Originally Authored by Balint Alkonyi, Harry T. Chugani, Michael Behen, Stacey Halverson, Emily Helder, Malek I, Makki, and Csaba Juhasz in the European Journal of Pediatric Neurology
Abstract
Background: SturgeeWeber syndrome (SWS) with unilateral hemispheric involvement is a clinical model of early onset, chronic, often progressive hemispheric injury, resulting in variable neuro-cognitive impairment.
Aims: To evaluate if abnormal diffusion and metabolism of the thalamus, a central relay station with extensive cortical connections, may serve as a simple imaging marker of neuro-cognitive dysfunction in SWS.
Methods: We obtained both diffusion tensor imaging and FDG PET in 20 children (11 girls; age range: 3 – 12.4 years) with unilateral SWS. Diffusion parameters as well as FDG uptake were measured in thalami, compared to normal control values, and correlated with the extent of cortical hypometabolism, deep venous abnormalities and cognitive (IQ) as well as fine motor functions.
Results: Children with SWS had significantly higher thalamic glucose metabolic asymmetry than controls ( p = 0.001). Thalamic metabolic asymmetries correlated positively with the asymmetry of thalamic diffusivity ( p = 0.001) and also with the extent of cortical hypometabolism ( p < 0.001). Severe thalamic asymmetries of glucose metabolism and diffusion were strong predictors of low IQ (metabolism: p = 0.002; diffusivity: p = 0.01), even after controlling for age and extent of cortical glucose hypometabolism in children with left hemispheric involvement. Ipsilateral thalamic glucose hypometabolism was also associated with impairment of fine motor functions ( p = 0.002).
Conclusions: Both diffusion and glucose metabolic abnormalities of the thalamus are closely related to cognitive functions, independent of age and cortical metabolic abnormalities, in children with unilateral SWS. Thalamic metabolic asymmetry is a robust but simple imaging marker of neuro-cognitive outcome in children with early unilateral hemispheric injury caused by SturgeeWeber syndrome.
Keywords: Sturge-Weber syndrome, Thalamus, Diffusion tensor imaging, positron emission tomography, glucose metabolism, cognitive function
Introduction
The SturgeeWeber syndrome (SWS) is a sporadic neurocutaneous disorder characterized by facial port wine stains, glaucoma and leptomeningeal angiomatosis involving one cerebral hemisphere in most of the cases (approximately 85%).(1) The most common neurologic manifestations of SWS are early onset seizures, hemiparesis, visual field cut and cognitive deficit.1 Progressive cognitive decline is apparent in about half of the patients and is often associated with intractable seizures. Nevertheless, seizures during the course of the disease fail to provide sufficient prognostic information for cognitive outcome.(2,3)
SWS is a unique clinical model to study the mechanisms of neuro-cognitive impairment due to early, chronic unilateral hemispheric lesions. It is generally thought that the anomalous vascular formation on the brain surface leads to venous stasis, secondary impairment of cerebral blood flow, hypoxia and chronic ischemia in the underlying brain tissue. Increased venous pressure in the deep venous system may affect venous outflow of deep gray matter structures such as thalamus, but the role of deep brain structure damage in neuro-cognitive progression of SWS has not been clarified.
Only a few studies have investigated the relationship between brain vascular and parenchymal abnormalities and severity of clinical symptoms during the course of SWS. In a semi-quantitative analysis, the severity of cortical atrophy strongly correlated with the general clinical status but only weakly with cognitive function scores.(4) A volumetric study of children with SWS has shown that hemispheric white matter volume in the affected hemisphere may be a better predictor of cognitive impairment than cortical gray matter volumes.(5) Subcortical white matter microstructural damage (extending beyond abnormal cortex), demonstrated by diffusion tensor imaging (DTI), may also contribute to neuro-cognitive impairment in SWS.(6) Using 2-deoxy-2[18F]fluoro-D-glucose (FDG) positron emission tomography (PET), we have previously demonstrated that the cognitive impairment in children with a relatively limited area of cortical hypometabolism may, paradoxically, be more severe than in those with early, extensive hemispheric progression, suggesting that early demise of the affected brain regions in SWS may lead to more efficient reorganization.(7)
Thalamus is a major relay station of the brain and could be affected both directly (by venous congestion in the deep veins) and indirectly (via cortico-thalamic connections) in SWS. Thalamic magnetic resonance imaging (MRI) and PET abnormalities have been commonly observed in intellectually disabled patients due to different pathophysiologic origins.(8-11) Therefore, it can be hypothesized that thalamic abnormalities may be a marker of abnormal neuro-cognitive functions in children with SWS. In this study, we have analyzed thalamic abnormalities using MRI (including DTI) and FDG PET scanning in a prospectively collected group of children with unilateral SWS. Specific goals of the study included: 1. To assess the presence of thalamic microstructural (using diffusion parameters from DTI) and glucose metabolic (using FDG PET) abnormalities and evaluate how these are related to severity of cortical metabolic changes. 2. To determine whether there is a relation between metabolic/ microstructural abnormalities of the thalamus and the severity of neuropsychological variables (cognitive and motor dysfunction) and to determine if thalamic asymmetries can provide a simple, independent imaging marker for cognitive and motor functions in SWS.
Subjects and methods
Subjects
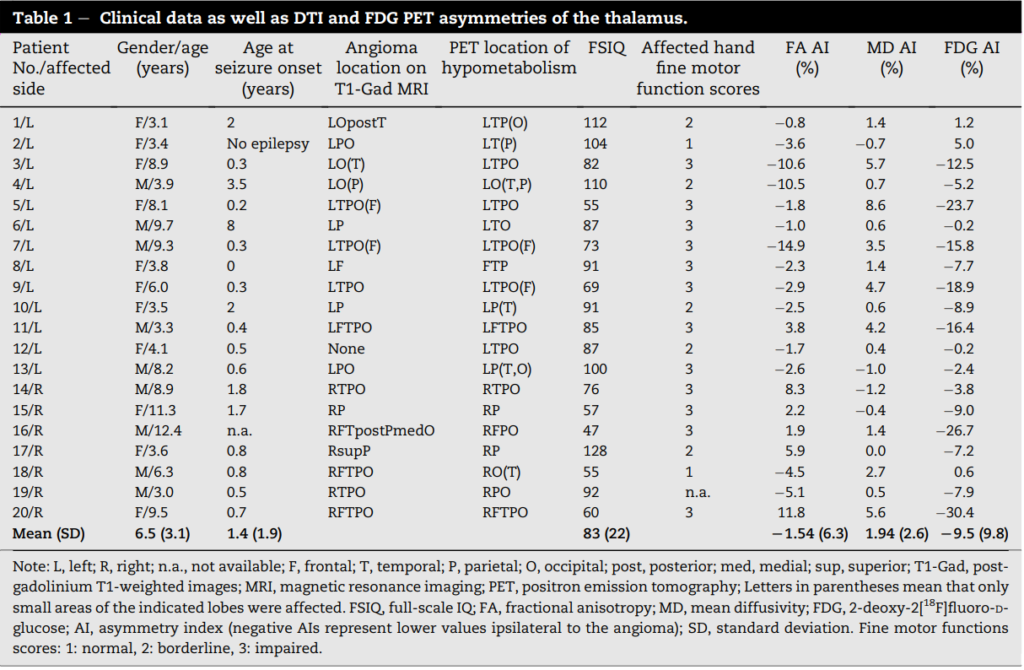
Twenty children (11 girls, age: 3 years-12.4 years; mean age: 6.5 years) with the diagnosis of SWS and unilateral hemispheric involvement were selected from a series of 42 patients, who participated in a prospective clinical and neuroimaging study of children with SWS. All selected patients met the following inclusion criteria: (1) age at least 3 years at the time of the imaging studies; this age limit was selected to include only children where verbal and performance IQ scores could be obtained using Wechsler intelligence scales; (2) presence of a facial port wine stain; (3) radiologic (MRI and FDG PET) evidence of unilateral brain involvement; (4) imaging studies including FDG PET and MRI with DTI, performed on consecutive days. Gadolinium enhanced MRI revealed unilateral leptomeningeal angiomatosis in all but one (patient 12, Table 1) case. In this latter patient, the presence of unilateral facial port wine stain, ipsilateral hypometabolism on FDG PET images and the history of seizures supported the diagnosis of SWS with unihemispheric involvement. Nineteen patients had a history of seizures and 18 of these patients were on antiepileptic drug (s), including oxcarbazepine (N = 9), levetiracetam (N = 6), carbamazepine (N = 3), topiramate (N = 2), phenobarbital (N = 2), valproate (N = 2) and lamotrigine (N = 1). Age at seizure onset varied from the day of birth to 8 years of age (mean age: 1.4 years; SD: 1.9). The mean duration of epilepsy was 5.0 years (SD: 3.1). Annual seizure frequency at the time of the PET scanning varied from 0 to 200 (median: 3). Clinical data of the patients were obtained from medical records and parent interviews (Table 1).
To compare the images of the patient group to normal controls, we used two control groups: for MRI/DTI images, we used a healthy control group consisting of 12 children (“DTI control group”) (5 girls; mean age: 11.8 years; range: 6-15.9 years); for FDG PET, we used images of 9 healthy children (“PET control group”, mean age: 11.2 years, range: 9.8-12.3 years). Both control groups were significantly older than the patient group (independent samples t-tests, p < 0.001), therefore, age was used as a covariate in group statistical analyses where indicated. Healthy children for the DTI as well as PET control groups were recruited based on the following inclusion criteria: (1) age above 5 for DTI and above 8 for PET studies; (2) global intellectual functioning above 85 (above population mean 1SD); (3) absence of current or historical medical, developmental, or psychiatric problems. All imaging and clinical studies were performed in compliance with regulations of Wayne State University’s Human Investigation Committee, and written informed consent of the parent or legal guardian was obtained.
Neuropsychological evaluation
All children with SWS underwent a comprehensive neuropsychologic assessment within 1 day of the PET study. Neuropsychologic testing was performed in the morning, before sedation for imaging. Intellectual function was assessed using either the Wechsler Preschool and Primary Scales of Intelligence Scales for Children, Third Edition (WPPSI-III; age 36e87 months), (12) or the Wechsler Intelligence Scales for Children, Third Edition (WISC-III; age > 87 months).(13) Global, verbal and nonverbal intellectual functioning were characterized by fullscale (FSIQ), verbal (VIQ) and performance IQs (PIQ), respectively. Children with SWS were also administered either the Purdue Pegboard task, (14) if less than 5 years of age, or the Grooved Pegboard task, (15) if older than 5 years of age. These tasks provide a measure of manual dexterity for both hands. The non-dominant hand of one of the patients (patient 19) could not be tested owing to lack of compliance. Raw manual dexterity scores were then ranked into 3 groups according to the severity of impairment (normal [T-score > 36] = score 1; borderline [T-score between 30 and 36] = score 2; impaired [raw score < 30] = score 3).
MRI data acquistion
All MR studies were carried out on a Sonata 1.5T MR instrument (Siemens, Erlangen, Germany) using a standard head coil. During the scanning phase of bothMR imaging and PET studies, SWS children younger than 7 years of age were sedated. Healthy children were never sedated during MRI and PET scanning. The MRI protocol for the patient group included an axial 3D gradient-echo T1-weighted, axial T2-weighted turbo spin-echo, DTI, susceptibility weighted imaging (SWI), followed by a post-gadolinium (Gad; 0.1 mmol/kg) T1-weighted acquisition. Additional MR sequences included dynamic perfusion weighted imaging (PWI), magnetic resonance angiography, and postgadolinium SWI, in some cases. DTI acquisition was performed using single-shot, diffusion weighted, echoplanar imaging. The acquisition parameters included: TR = 6600; TE = 97 ms; NEX = 8; acquisition matrix = 128 128; bandwidth = 95 KHz; FOV = 230 230 3 (mm3) , voxel size = 1.8 1.8 (3mm) with two b values (0, 1000 s/(mm2) ) applied sequentially in 6 noncollinear directions. In the DTI control group, only diffusion tensor (using the parameters detailed above) and volumetric T1-weighted images (not used in the present study) were obtained.
PET scanning protocol
The details of FDG PET acquisition and data analysis have been described previously.(7) In brief, PET scans were acquired using an EXACT/HR PET scanner (CTI/Siemens, Knoxville, TN) which provides simultaneous acquisition of 47 contiguous transaxial images with a slice thickness of 3.125 mm. The reconstructed image resolution obtained was 5.5 0.35 mm at full width at half-maximum in-plane and 6.0 0.49 mm at full width at half-maximum in the axial direction (reconstruction: filtered backprojection using Shepp-Logan filter with 0.3 cycles/pixel cutoff frequency). Scalp EEG was monitored in all SWS children during the tracer uptake period. Initially, 5.29 MBq/kg (mean: 127.5 MBq; SD: 71) of FDG was injected intravenously as a slow bolus followed by a 30 min uptake period. Forty minutes after injection, a static 20-min emission scan was acquired parallel to the canthomeatal plane. Calculated attenuation correction was applied to the brain images using automated threshold fits to the sonogram data.(16) FDG PET scans were acquired for all of the patients and PET control subjects using the same scanner; however, normal controls were administered a calculated dose (mean: 119.6 MBq; SD: 8.9) of FDG to keep the whole body radiation dose below the FDA limit defined for volunteers participating in research studies (injected dose was up to 148 MBq in children below 15 years of age). This slight difference in the radiation dose between the patients and controls likely did not influence brain asymmetry measures, which were used to evaluate thalamic abnormalities in glucose metabolism.
Image analysis
DTI image processing and PET/DTI co-registration. Fractional anisotropy (FA) and mean diffusivity (MD) maps were created using the DTI Studio software.(17) Initially, the T2- weighted (b~0 s/mm2 ) image of the DTI sequence (b0 images), as well as the FA and MD maps were displayed in three orthogonal orientations and realigned with the use of an interactive registration software (VINCI 2.50; Max Planck Institut, Cologne, Germany)(18) in order to achieve a symmetric appearance of the basal ganglia and thalami. Subsequently, FDG PET images were co-registered to the b0 series of the DTI sequences.
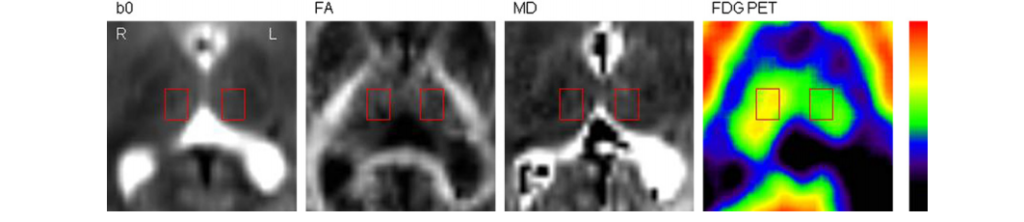
Measurements of thalamic abnormalities using regions of interest (ROIs). Thalamic diffusion and metabolic values were obtained by using rectangular shaped ROIs drawn on 4 consecutive planes of the thalamus. This sampling method, rather than an attempt to delineate the borders of the entire thalamus was selected because the PET control subjects had no MR images available, and accurate, reproducible delineation of thalamic borders on PET images would have been difficult. For thalamic measurements in the SWS group and also in the DTI control group, ROIs were drawn on b0 images using the software MIPAV, Version 4.3.0, (19) by one of the investigators (B.A.), who was unaware of the identity of the patients at that time. ROIs of exactly the same size were defined in left and right, symmetric portions of the thalami in 4 consecutive planes, starting with the top axial plane where the thalamus was first clearly visible. ROIs were then superimposed on FA and MD maps to calculate FA and MD values for each thalamus (Fig. 1). Mean FA and MD values were calculated as the average of all voxels of all ROIs on each side. The total size of the 4 ROIs encompassing the thalamus on each side ranged between 54 and 100 voxels (525e972 mm3 ). In order to omit voxels which likely belong to adjacent white matter structures or the lateral ventricles, voxels with FA > 0.5 and/or MD > 1.3 103 mm2 /s were removed from the calculation.(20) In the patient group, the same DTI-based thalamic ROIs were also overlaid onto the co-registered FDG PET images and average radioactivity concentrations for each thalamus were measured. Since the PET control subjects did not have MRI scans, ROIs for the thalamus in this group were drawn directly on the axial PET images, by implementing the standardized rules of ROI definition. Subsequently, % asymmetry indices (AIs) for both DTI measures and PET radioactivity concentration values of the thalamus were calculated in the patients as follows: AI (%) = 200 [(I C )/(I þ C )], where I represents ipsilateral, C represents contralateral values as compared to the side of the lesion. In the control group, absolute as well as left minus right AI (%) values were calculated for between-group comparisons. To calculate intrarater reliability of the measurements, ROI placement was repeated after 3 weeks for all 20 patients by the same investigator. Interrater reliability was evaluated by comparing ROI drawings of two observers (B.A. and C.J.) in 10 randomly selected patients.
Measurement of the extent of cortical hypometabolism in the affected hemisphere. To evaluate a potential correlation between thalamic and cortical metabolic abnormalities, the hemispheric extent of cortical glucose hypometabolism on the side of the angioma was obtained by using a semiautomated software package as described earlier.(7,21) A 10% asymmetry threshold for the definition of cortical hypometabolism was used based on considerations described previously.(22,23) The size of marked cortical hypometabolism was expressed as the percent of total ipsilateral hemispheric surface, a value independent of the actual size of the hemisphere.
Study design and statistical analysis
Initially, intrarater and interrater reliabilities were evaluated. ROI values of repeated measures were compared by calculating % differences (mean and SD). Pearson correlations were also applied to the corresponding values of two ROI drawings. To evaluate potential presence of thalamic asymmetries in the control group, paired t-tests were performed to compare corresponding left and right values of MD, FA and FDG radioactivity concentrations.
Presence of imaging abnormalities of the thalamus in the patient group was assessed with group comparisons. Group comparisons were performed in three ways: (1) Analysis of covariance (ANCOVA), with age as a covariate, was applied to compare thalamic FA and MD values of patients with similar values of the control subjects; for thalamic FDG PET abnormalities, this analysis was not done, since absolute tracer uptake values were not evaluated in between-group comparisons. (2) AIs of thalamic MD, FA and FDG radioactivity concentration values were compared between the whole SWS group and the corresponding control groups by performing independent samples t-tests using absolute values of AIs. This analysis was also repeated with the subgroup of patients with left hemispheric involvement by using left minus right asymmetries; the right hemispheric subgroup was not analyzed separately due to its small sample size. (3) FA, MD as well as average FDG radioactivity concentration values were also compared between thalami ipsi- and contralateral to the affected hemisphere using paired t-tests.
In the next step, potential associations of thalamic metabolic abnormalities were analyzed by correlating thalamic FDG PET asymmetries (AI values) with potential imaging and clinical predictors including: (1) AIs of DTI measures, (2) extent of cortical hypometabolism, and (3) age as well as age at seizure onset using Pearson’s correlations. Subsequently, to determine if extent of cortical hypometabolism was an age-independent predictor of thalamic FDG asymmetries, a multiple linear regression analysis was performed with extent of cortical hypometabolism and age as predictors and thalamic FDG AI values as the outcome.
In the final step, the potential role of thalamic abnormalities in cognitive and fine motor functions was evaluated. First, univariate correlations (Pearson’s product moment) were performed between FSIQ scores and potential predictors such as patient age, age at seizure onset, thalamic DTI and PET asymmetries as well as extent of cortical hypometabolism. In addition, IQ scores of patients with controlled seizures (no seizures during the last year before PET scan; N = 7) and uncontrolled seizures (N = 12) were also compared using an independent samples t-test. All variables with alpha values ( p < 0.1) were entered into a subsequent multiple linear regression analysis to determine the independent contribution of each variable to IQ. This procedure was repeated for cognitive subdomains (VIQ and PIQ) and tested for the whole group as well as in the larger subgroup with left hemispheric involvement (n = 13) to assess side-specific effects of thalamic injury; again, the right hemispheric subgroup was not analyzed separately due to its limited sample size. Finally, to test the potential association between the FDG AIs of the thalamus and the ranking scores for dexterity in the affected hand (contralateral to the angioma), Spearman’s correlation was applied. Statistical analysis was performed using SPSS 17.0 (Chicago, IL) software package and p < 0.05 was considered significant.
Results
Both intra- and interrater reliabilities were very high for both DTI and FDG PET values, with correlation coefficients above 0.98 ( p < 0.001) for intra- and above 0.91 ( p < 0.001) for interrater measurements. Mean SD of differences between two ROI drawings ranged from 0.3 plus or minus 0.4% to 1.1 plus or minus 1.0% for intraand from 0.5 plus or minus 0.6% to 3.3 plus or minus 2.4% for interrater measurements.
There was no significant difference between left and right thalamic FA (0.305 vs. 0.302, respectively, p = 0.49) and MD values (7.91 104 mm2 /s vs. 7.86 104 mm2 /s, respectively, p = 0.19) in the control subjects. Therefore, average values of the two sides were used in the group comparisons. Average FDG radioactivity concentration of the left and right thalami also did not differ in the PET control group ( p = 0.48).
Diffusion and metabolic abnormalities of the thalamus
In the between-group comparisons, neither FA nor MD values of the ipsi- (mean SD: 0.277 0.025 and 8.0 104 mm2 / s 4.4 105 mm2 /s) or contralateral thalami (mean SD: 0.281 0.02 and 7.8 104 mm2 /s 3.4105 mm2 /s) differed from the values of the DTI control group (left-right mean SD: 0.304 0.02 and 7.9 104 mm2 /s 1.9105 mm2 /s) after controlling for age ( p > 0.35). Also, neither FA AI nor MD AI values of the SWS group differed significantly from those of the control group (p = 0.30 and p = 0.33, respectively); however, the FA AI values of the subgroup of SWS patients with left hemispheric involvement were significantly higher (p = 0.019) and the MD AI values were slightly higher (p = 0.085) than those of the control group. Also, FDG AIs of the whole SWS group as well as the subgroup with left hemispheric involvement were higher than those of the control group (p = 0.001 and p = 0.004, respectively).
In paired comparisons (comparing ipsi- vs. contralateral thalamus in the whole patient group), MD values of the ipsilateral thalami were higher than those of the contralateral thalami ( p = 0.004). In addition, higher MD ( p = 0.013) and lower FA values ( p = 0.014) were found on the affected (left) side in the subgroup of patients with left hemispheric involvement (n = 13). The average FDG radioactivity concentration of the thalamus on the affected side was significantly lower than that on the contralateral side ( p = 0.001).
Imaging and clinical correlates of metabolic abnormalities of the thalamus
There was a significant correlation between the glucose metabolic AIs and MD AIs (r = 0.69; p = 0.001, indicating that lower ipsilateral thalamic glucose metabolism was associated with higher MD values). This correlation was even stronger in the subgroup of patients with left hemispheric involvement (N = 13; r = 0.88; p < 0.001). However, there was no correlation between the FA AI and glucose metabolic AI of the thalamus ( p > 0.3). The extent of cortical hypometabolism varied widely among the patients (between 1 and 84% of the hemispheric surface), and showed a strong correlation with the glucose metabolic AI of the thalamus (r = 0.75; p < 0.001, indicating that lower ipsilateral thalamic glucose metabolism is associated with larger extent of cortical hypometabolism). In addition, thalamic glucose metabolic AIs were higher (more negative) in older patients (r = 0.45; p = 0.04), but there was no correlation with the age at seizure onset ( p = 0.11). Finally, the multiple regression analysis (with age and extent of cortical hypometabolism) showed that the extent of cortical hypometabolism was an independent predictor of the glucose metabolic AI of the thalamus (r = 0.70; p = 0.001).
Relationship between cognitive functions, motor functions and glucose metabolic asymmetries of the thalamus
Table 1 summarizes the neuropsychological data of the 20 patients. FSIQ, VIQ and PIQ scores ranged between 47 and 128 (mean: 83), 46 and 139 (mean: 90) and 47 and 111 (mean: 79), with values falling below the population mean 2 SD (i.e., below 70) in 6, 5 and 7 patients, respectively. In univariate analyses, we found a significant correlation between FSIQ and thalamic metabolic (r = 0.59, p = 0.006) as well as MD AIs (r = 0.48, p = 0.03) in the whole group. These relationships were even stronger in the left subgroup of patients (for FDG AI: p < 0.001; for MD AI: p = 0.001). IQ was also inversely associated with the patients’ age (r = 0.70, p = 0.001), and there was also a trend for correlation with the extent of cortical hypometabolism (r = 0.44, p = 0.051). The age at onset of seizures as well as seizure control did not show association with IQ (p = 0.45 and p = 0.63, respectively). The two potential predictors of IQ (age and extent of cortical hypometabolism) were entered in the subsequent multiple regression analysis, together with thalamus MD and glucose metabolic AIs as predictors (two separate regression analyses were performed for these thalamic variables). Although neither glucose metabolic nor MD AIs of the thalamus showed a significant correlation (r = 0.38, p = 0.12; r = 0.45, p = 0.058, respectively) with FSIQ in the multiple regression analysis of the whole SWS group, in the subgroup of children with left hemispheric involvement, both of these imaging variables were significant independent predictors of FSIQ (FDG AI: r = 0.81, p = 0.002; MD AI: r = 0.73, p = 0.01) (see Figs. 2 and 3). Similar correlations of the thalamic glucose metabolic and MD asymmetries were found with both VIQ and PIQs (detailed data not shown). Motor function of the hand contralateral to the affected hemisphere also correlated with the glucose metabolic AI of the thalamus (r = 0.66; p = 0.002), but not with FA ( p = 0.33) and MD AIs ( p = 0.26).
Discussion
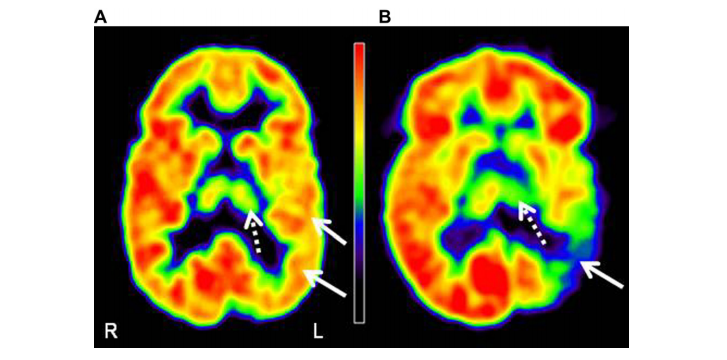
110). (B) The image of an 8 years old girl (patient 5) shows severe thalamic hypometabolism (dashed arrow; AI: -23.7%). This patient’s cognitive functions were severely impaired (full-scale IQ: 55). L = left, R = right.
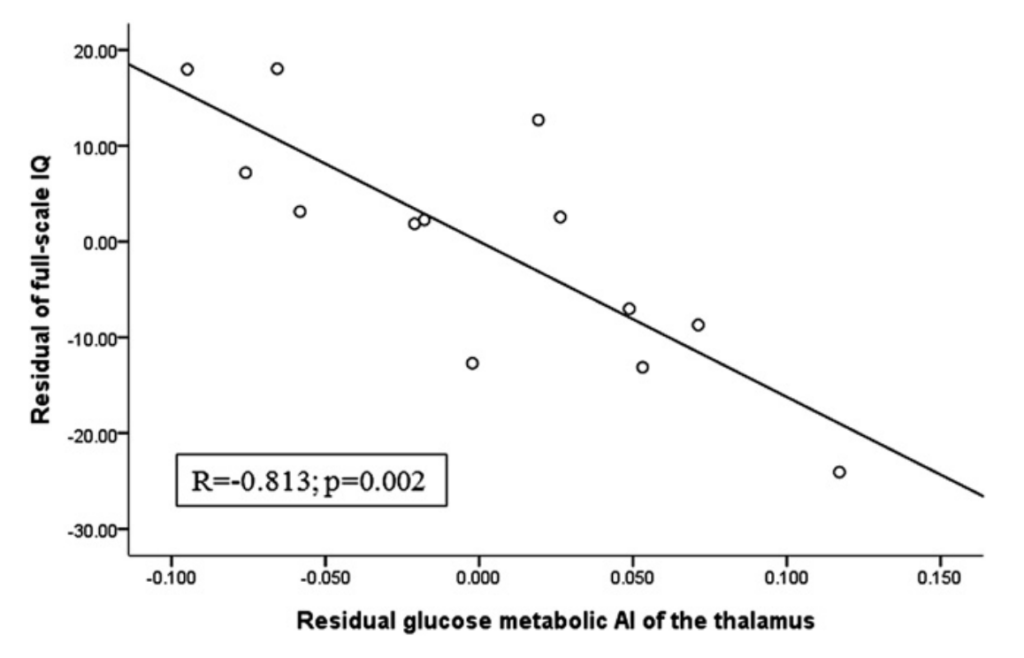
regressing asymmetry and full-scale IQ on age and extent of hypometabolic cortex. Full-scale IQ showed a strong negative correlation with glucose metabolic AI of the thalamus even after controlling for other predictors.
The present study demonstrates significant metabolic, but less robust microstructural, impairment of the thalamus in the affected hemisphere in children with unilateral SWS. The clinical relevance of the thalamic abnormalities is that metabolic and diffusion asymmetries of the thalamus are strongly associated with cognitive functions; thalamic metabolic asymmetry is also a good predictor of fine motor functions. Importantly, in the subgroup of patients with left hemispheric involvement, thalamic metabolic and diffusion asymmetries predict IQ independently of the patients’ age and extent of cortical involvement. The lack of such a strong predictive value of these asymmetries in the whole group suggests that the impact of thalamic impairment on cognitive functioning in the two hemispheres of the brain may differ; larger studies including more patients with right-sided involvement are required to understand such differences. Although this is a cross sectional study with limited number of subjects, our multimodal imaging data strongly suggest that structural and functional impairment of the thalamus, conveniently assessed by DTI and FDG PET imaging, is a strong, objective marker of cognitive and motor functioning in children with SWS.
Potential predictors of neuro-cognitive outcome in SWS
SturgeeWeber syndrome is often a progressive disease with widely varying degree of clinical and structural impairment among patients. Although cognitive impairment is often associated with intractable seizures, several studies failed to reveal sufficient prognostic value of seizure variables.(2,24,25) Consistent with these previous results, age at seizure onset did not correlate with neuropsychological variables and neuroimaging abnormalities in our study. Notably, seizures of most patients involved in our study were relatively well controlled. Furthermore, accurate estimation of long-term seizure severity would have been difficult due to the common sporadic, clustering seizure pattern described in SWS.(25) Young children with severe, intractable seizures, who commonly undergo early resective surgery, were not included in this study. Therefore, investigation of the potential role of seizure frequency was beyond the scope of the present study. Our previous SWS studies looking at neuroimaging correlates of cognitive decline evaluated the potential role of cortical hypometabolism as well as gray and white matter volume changes.(5,7,26) A cross sectional PET study from our group described that early, severe cortical hypometabolism in the affected hemisphere, surprisingly, was associated with better intellectual function.7 It has been hypothesized that early onset, rapid progression of unilateral cortical dysfunction may trigger effective reorganization leading to relatively preserved cognitive functions in some children.(7,26) In a semi-quantitative analysis, Kelley et al. (2005)4 found a weak correlation between the degree of cortical atrophy and cognitive function. The results of an MRI/PET multimodality analysis in 13 children with SWS suggested that white matter damage underlying the cortical hypometabolism as well as in adjacent areas may also contribute to cognitive deficit.(6) In concordance with this finding, a recent study found that ipsilateral white matter volume appeared to be a predictor of full-scale IQ.5 However, white matter volumes cannot be used as a simple, clinically feasible imaging marker of neuro-cognitive functions.
Thalamic dysfunction in SWS
Although simultaneous DTI and glucose PET analysis of the thalamus/thalamocortical pathways has already been performed in a few studies in different patient populations,(27,28) functional and microstructural impairment of the thalamus in children with early hemispheric damage, such as caused by SWS, has not been evaluated. Our data demonstrate that the metabolism of the ipsilateral thalamus is significantly impaired in patients with unilateral SWS. Since diffusion asymmetries of the thalamus were less robust, DTI images are more difficult to interpret for assessment of thalamic damage. Despite this, glucose metabolic asymmetries showed a tight correlation with mean diffusivity but not with FA asymmetries. A plausible reason for the lack of association between FA AI and glucose metabolic AI of the thalamus can be that functional impairment of the thalamus may be more related to neuronal loss and the expansion of the extracellular space rather than tissue disorganization. A similar explanation was suggested in previous studies where diffusivity was found to be a more sensitive diffusion index than FA in identifying epileptogenic cortex.(29,30) Therefore, despite the small asymmetries, MD appears to be a more useful diffusion measure in evaluating microstructural abnormality of the thalamus in SWS.
The mechanism of functional deterioration of the thalamus in SturgeeWeber syndrome is not completely clear. Thalamic dysfunction (in the form of “diaschisis” or ipsilateral atrophy) is commonly seen following cortical injury.(20,27,31-34) The association between the cortical extent of hypometabolism with the degree of thalamic hypometabolism in our study supports this mechanism. In addition, increased venous pressure on the brain surface may force deep draining veins to channel blood to the deep venous system that also drains venous blood from the thalami. These pressure changes may directly affect thalamic venous outflow, leading to hypoxic injury, or could indirectly affect the thalamus via hypoxic injury of white matter tracts connected to various thalamic nuclei.
Relation between cognitive function and the thalamus
Previous research has failed to identify one central executive region responsible for “intelligence” in healthy subjects, but revealed the potential role of multiple, anatomically and functionally connected areas, including distinct cortical regions, cerebellum and thalamus.(35,36)The thalamus is amajor relay center of the brain with both afferent sensory as well as extensive reciprocal cortical connections. Recent studies have also suggested that thalamus is an integrator of multisensory and sensorimotor functions.(37) Therefore, it is not surprising that even isolated damage of the thalamus may result in cognitive dysfunction.(38) Studies investigating the potential neuroanatomical substrates of cognitive impairment from various causes demonstrated abnormalities of the thalamus.(8-11) Recent neuroimaging and EEG data also supported the participation of the thalamus in the network responsible for cognitive performance.(39,40) In line with these previous findings, here we demonstrate that the damage of the thalamus, a central structure integrating and therefore representing abnormalities of widespread, connected white matter and gray matter regions, may be a simple, robust predictor of IQ. In addition, thalamic hypometabolism strongly correlates with dexterity of the affected hand in patients with SWS. The thalamus is indeed part of a complex network responsible for fine motor function,(41,42) therefore, the observed correlation with dexterity scores actually represents association with anatomically and functionally connected structures.
Methodological considerations
There are some limitations that need to be noted when interpreting our results. Firstly, the patients were selected using a lower age limit of 3 years. Although the neurologic manifestations of SWS often present at earlier ages, including only children above 3 years allowed us to analyze a patient sample with a wide range of cognitive and motor dysfunction and obtain accurate, uniform cognitive and motor scores.
A standard shaped ROI was used in a simple, well reproducible way, but at the same time to minimize partial volume effects from adjacent structures. The diffusivity and anisotropy values in our work are comparable to previous studies delineating the entire thalamus(20,43); thus, we believe that our DTI metric values are good estimates of the entire thalamus. Furthermore, the extremely high concordance between repeated measurements demonstrates the reliability of this approach. The application of an asymmetry-based method with respect to glucose metabolism is advantageous because it is not confounded by interindividual differences in absolute glucose metabolic rates arising from brain development, as well as global effects of antiepileptic drugs.(44-46) In addition, this approach eliminates the use of normalized values of glucose uptake, which can show age-related changes in the thalamus during human brain development(47) and would require an agematched control group to perform accurate comparisons.
It should be also noted that we have used, for the first time, a pediatric control group for FDG PET studies. This was done after careful consideration and review of all available data regarding potential health risks from low-dose radiation. The studies overwhelmingly indicate that radiation doses from a single PET scan are not above the “noise” of adverse events of everyday life, and none of the previous studies has been able to show unequivocal carcinogenic effect of low-level radiation doses.48e50
Conclusion
In summary, our findings suggest that metabolic asymmetry of the thalamus demonstrated by FDG PET is a simple, robust, clinically useful imaging marker of neuro-cognitive functions in SWS. Future longitudinal studies are needed to assess whether thalamic dysfunction in children with SWS is progressive and if early damage of the thalamus could predict cognitive outcome in the later course of the disease.
Acknowledgements
This work was supported by the grant from the National Institute of Neurological Disorders and Stroke (R01 NS041922 to C. Juhasz). The authors thank Thomas Mangner, Ph.D. and Pulak Chakraborty, Ph.D. for the reliable radiosynthesis of 2-18F-fluoro-2-deoxy-D-glucose, as well as Galina Rabkin,
CNMT, Angie Wigeluk, CNMT, Carole Klapko, CNMT and MeiLi Lee, MS, for their expert technical assistance in performing the PET studies. We also thank the SturgeeWeber Foundation for referring patients to us. We are grateful to the families and children who participated in the study.
References
1. Roach ES, Bodensteiner JB. Neurologic manifestations of SturgeeWeber syndrome. In: Bodensteiner JB, Roach ES, editors. SturgeeWeber syndrome. Mt Freedom, NJ: SturgeeWeber Foundation; 1999. p. 27e38.
2. Sujansky E, Conradi S. Outcome of SturgeeWeber syndrome in 52 adults. Am J Med Genet 1995;57:35e45.
3. Aicardi J, Arzimanoglou A. SturgeeWeber syndrome. Int Pediatr 1991;6:129e34.
4. Kelley TM, Hatfield LA, Lin DD, Comi AM. Quantitative analysis of cerebral cortical atrophy and correlation with clinical severity in unilateral SturgeeWeber syndrome. J Child Neurol 2005;20:867e70.
5. Juhasz C, Lai C, Behen ME, Muzik O, Helder EJ, Chugani DC, et al. Whitematter volume as amajor predictor of cognitive function in SturgeeWeber syndrome. Arch Neurol 2007;64:1169e74.
6. Juhasz C, Haacke EM, Hu J, Xuan Y, Makki M, Behen ME, et al. Multimodality imaging of cortical and white matter abnormalities in SturgeeWeber syndrome. AJNR Am J Neuroradiol 2007;28:900e6.
7. Lee JS, Asano E, Muzik O, Chugani DC, Juhasz C, Pfund Z, et al. SturgeeWeber syndrome: correlation between clinical course and FDG PET findings. Neurology 2001;57:189e95.
8. Rausch R, Henry TR, Ary CM, Engel Jr J, Mazziotta J. Asymmetric interictal glucose hypometabolism and cognitive performance in epileptic patients. Arch Neurol 1994;51:139e44.
9. Kato T, Nakayama N, Yasokawa Y, Okumura A, Shinoda J, Iwama T. Statistical image analysis of cerebral glucose metabolism in patients with cognitive impairment following diffuse traumatic brain injury. J Neurotrauma 2007;24:919e26.
10. Spencer MD, Moorhead TW, Lymer GK, Job DE, Muir WJ, Hoare P, et al. Structural correlates of intellectual impairment 432 european journal of paedi atric neurology 14 (2010) 425 e433 and autistic features in adolescents. Neuroimage 2006;33: 1136e44.
11. Mannerkoski MK, Heiskala HJ, Van Leemput K, Aberg LE, Raininko R, Hamalainen J, et al. Subjects with intellectual disability and familial need for full-time special education show regional brain alterations: a voxel-based morphometry study. Pediatr Res 2009;66:306e11.
12. Wechsler D. Wechsler Preschool and primary scale of intelligence -III. San Antonio, TX: The Psychological Corporation; 2002.
13. Wechsler D. Manual for the Wechsler intelligence scale for children. 3rd ed. San Antonio, TX: The Psychological Corporation; 1991.
14. Tiffin J, Asher EJ. The Purdue pegboard; norms and studies of reliability and validity. J Appl Psychol 1948;32:234e47.
15. Trites RL. Lafayette Grooved pegboard task. Instruction/Owner’s manual. Lafayette, IN: Lafayette Instrument Company; 1989.
16. Bergstrom M, Litton J, Eriksson L, Bohm C, Blomqvist G. Determination of object contour from projections for attenuation correction in cranial positron emission tomography. J Comput Assist Tomogr 1982;6:365e72.
17. Jiang H, van Zijl PC, Kim J, Pearlson GD, Mori S. DtiStudio: resource program for diffusion tensor computation and fiber bundle tracking. Comput Methods Programs Biomed 2006;81: 106e16.
18. Cizek J, Herholz K, Vollmar S, Schrader R, Klein J, Heiss WD. Fast and robust registration of PET and MR images of human brain. Neuroimage 2004;22:434e42.
19. McAuliffe MJ, Lalonde FM, McGarry D, Gandler W, Csaky K, Trus BL. Medical image processing, analysis & visualization in clinical research. IEEE Computer-Based Medical Systems (CBMS); 2001. 381e386.
20. Gong G, Concha L, Beaulieu C, Gross DW. Thalamic diffusion and volumetry in temporal lobe epilepsy with and without mesial temporal sclerosis. Epilepsy Res 2008;80:184e93.
21. Muzik O, Chugani DC, Shen C, da Silva EA, Shah J, Shah A, et al. Objective method for localization of cortical asymmetries using positron emission tomography to aid surgical resection of epileptic foci. Comput Aided Surg 1998;3:74e82.
22. Juhasz C, Batista CE, Chugani DC, Muzik O, Chugani HT. Evolution of cortical metabolic abnormalities and their clinical correlates in SturgeeWeber syndrome. Eur J Paediatr Neurol 2007;11:277e84.
23. Benedek K, Juhasz C, Chugani DC, Muzik O, Chugani HT. Longitudinal changes in cortical glucose hypometabolism in children with intractable epilepsy. J Child Neurol 2006;21:26e31.
24. Kramer U, Kahana E, Shorer Z, Ben-Zeev B. Outcome of infants with unilateral SturgeeWeber syndrome and early onset seizures. Dev Med Child Neurol 2000;42:756e9.
25. Kossoff EH, Ferenc L, Comi AM. An infantile-onset, severe, yet sporadic seizure pattern is common in SturgeeWeber syndrome. Epilepsia 2009;50:2154e7.
26. Behen ME, Juha´ sz C, Helder E, Batista CEA, Chugani DC, Chugani HT. Cognitive function in SturgeeWeber syndrome: effect of side and extent of severe hypometabolism on PET scanning [abstract]. Ann Neurol 2006;60(Suppl. 3):S122.
27. Kimiwada T, Juhasz C, Makki M, Muzik O, Chugani DC, Asano E, et al. Hippocampal and thalamic diffusion abnormalities in children with temporal lobe epilepsy. Epilepsia 2006;47:167e75.
28. Stenset V, Grambaite R, Reinvang I, Hessen E, Cappelen T, Bjornerud A, et al. Diaschisis after thalamic stroke: a comparison of metabolic and structural changes in a patient with amnesic syndrome. Acta Neurol Scand Suppl 2007;187:68e71.
29. Rugg-Gunn FJ, Eriksson SH, Symms MR, Barker GJ, Duncan JS. Diffusion tensor imaging of cryptogenic and acquired partial epilepsies. Brain 2001;124:627e36.
30. Salmenpera TM, Simister RJ, Bartlett P, Symms MR, Boulby PA, Free SL, et al. High-resolution diffusion tensor imaging of the hippocampus in temporal lobe epilepsy. Epilepsy Res 2006;71:102e6.
31. Henry TR, Mazziotta JC, Engel Jr J, Christenson PD, Zhang JX, Phelps ME, et al. Quantifying interictal metabolic activity in human temporal lobe epilepsy. J Cereb Blood Flow Metab 1990; 10:748e57.
32. Natsume J, Bernasconi N, Andermann F, Bernasconi A. MRI volumetry of the thalamus in temporal, extratemporal, and idiopathic generalized epilepsy. Neurology 2003;60:1296e300.
33. Govaert P, Zingman A, Jung YH, Dudink J, Swarte R, Zecic A, et al. Network injury to pulvinar with neonatal arterial ischemic stroke. Neuroimage 2008;39:1850e7.
34. Benedek K, Juhasz C, Muzik O, Chugani DC, Chugani HT. Metabolic changes of subcortical structures in intractable focal epilepsy. Epilepsia 2004;45:1100e5.
35. Frangou S, Chitins X, Williams SC. Mapping IQ and gray matter density in healthy young people. Neuroimage 2004;23: 800e5.
36. Haber SN, Calzavara R. The cortico-basal ganglia integrative network: the role of the thalamus. Brain Res Bull 2009;78: 69e74.
37. Cappe C, Morel A, Barone P, Rouiller EM. The thalamocortical projection systems in primate: an anatomical support for multisensory and sensorimotor interplay. Cereb Cortex 2009; 19:2025e37.
38. Karussis D, Leker RR, Abramsky O. Cognitive dysfunction following thalamic stroke: a study of 16 cases and review of the literature. J Neurol Sci 2000;172:25e9.
39. Cantero JL, Atienza M, Gomez-Herrero G, Cruz-Vadell A, GilNeciga E, Rodriguez-Romero R, et al. Functional integrity of thalamocortical circuits differentiates normal aging from mild cognitive impairment. Hum Brain Mapp 2009;30: 3944e57.
40. Curie A, Sacco S, Bussy G, de Saint Martin A, Boddaert N, Chanraud S, et al. Impairment of cerebello-thalamo-frontal pathway in Rab-GDI mutated patients with pure mental deficiency. Eur J Med Genet 2009;52:6e13.
41. Asanuma H, Arissian K. Experiments on functional role of peripheral input to motor cortex during voluntary movements in the monkey. J Neurophysiol 1984;52:212e27.
42. McFarland NR, Haber SN. Convergent inputs from thalamic motor nuclei and frontal cortical areas to the dorsal striatum in the primate. J Neurosci 2000;20:3798e813.
43. Lebel C, Walker L, Leemans A, Phillips L, Beaulieu C. Microstructural maturation of the human brain from childhood to adulthood. Neuroimage 2008;40:1044e55.
44. Theodore WH, Bromfield E, Onorati L. The effect of carbamazepine on cerebral glucose metabolism. Ann Neurol 1989;25:516e20.
45. Gaillard WD, Zeffiro T, Fazilat S, DeCarli C, Theodore WH. Effect of valproate on cerebral metabolism and blood flow: an 18F-2-deoxyglucose and 15O water positron emission tomography study. Epilepsia 1996;37:515e21.
46. Chugani HT, Phelps ME, Mazziotta JC. Positron emission tomography study of human brain functional development. Ann Neurol 1987;22:487e97.
47. Van Bogaert P, Wikler D, Damhaut P, Szliwowski HB, Goldman S. Regional changes in glucose metabolism during brain development from the age of 6 years. Neuroimage 1998;8: 62e8.
48. Doody MM, Mandel JS, Boice Jr JD. Employment practices and breast cancer among radiologic technologists. J Occup Environ Med 1995;37:321e7.
49. Tubiana M, Aurengo A, Masse R, Valleron AJ. Risk of cancer from diagnostic X-rays. Lancet 2004;363:1908. author reply 1910.
50. Tubiana M. Computed tomography and radiation exposure. N Engl J Med 2008;358:850. author reply 852e853.