
Originally AUthored by Carlos E. A. Batista, Harry T. Chugani, Jiani Hu, Mark Haacke, Michael E. Behen, Emily J. Helder, and Csaba Juhasz in the Journal of Neuroimaging
Abstract
BACKGROUND – In Sturge-Weber syndrome (SWS), structural MRI abnormalities are most common in the posterior brain regions. Frontal lobe involvement increases the risk of motor impairment. The goal of this study was to determine whether Magnetic Resonance Spectroscopic Imaging (MRSI) can improve detection of frontal lobe involvement in children with SWS.
METHODS – Sixteen children (age: .9-10.4 years) with unilateral SWS underwent MRI with MRSI prospectively. N-acetyl-aspartate (NAA) and choline asymmetries in the posterior and frontal regions were measured.
RESULTS – Eight children presented normal-appearing frontal lobes on conventional MRI, but 7 of them showed abnormal NAA and/or choline content in the frontal lobe of the affected hemisphere. Lower frontal lobe gray matter NAA was associated with earlier onset of seizures (r = .76; P = .04) and impaired motor function (r = −.89, P < .001). Frontal NAA asymmetry was an independent predictor of motor function in a regression analysis (P = .01)
CONCLUSION – MRSI is more sensitive than conventional structural MRI for detection of frontal lobe involvement in SWS. Decreased frontal lobe NAA is an excellent predictor of motor functions. Thus, MRSI can provide complementary information for the assessment of normal-appearing brain regions, and may assist prognosis evaluation in children with SWS.
Keywords: Sturge-Weber syndrome, magnetic resonance spectroscopic imaging, frontal lobe, N-acetyl-aspartate, motor function, seizures onset
Introduction
Sturge-Weber syndrome (SWS) is characterized by vascular malformations present in the skin (port wine stain), eye, and meninges (leptomeningeal angioma).1 The intracranial vascular anomaly is most often unilateral and involves the occipital and parietal lobes, although it might affect other lobes and spare the most posterior region in some cases.2 Seizures are the most common neurologic complications, varying from 72% to 93% in unilateral and bilateral involvement, respectively.3 Motor development delay, another potential manifestation that worsens the clinical scenario, may be an early neurologic presentation of SWS.4 Although SWS may eventually progress, many patients remain neurologically normal for months or even years before developing neurological symptoms.4 No current diagnostic tool can reliably predict the clinical course. Neuroimaging techniques have been routinely employed in the assessment of children with SWS, and several authors have shown relationships between neuroimaging findings and clinical presentation. A past study with CT and MRI reported that white matter changes, extent of lobar involvement, and the degree of parenchymal atrophy all correlated with the clinical status, including seizure control, hemiparesis, and the degree of psychomotor development.5 Studies using positron emission tomography (PET) with 2-deoxy-2[18 F]fluoro-D-glucose (FDG) have demonstrated that regions apparently normal on structural imaging might also be affected.6,7 Despite its usefulness, PET represents a costly study not available in many health centers, and the radiation exposure (albeit minimal) raises concern in some parents. Proton magnetic resonance spectroscopy (MRS) is more available and provides noninvasive information on some tissue metabolites with well-established applications in the assessment of various brain disorders.8 The ability of MRS to detect involvement of brain regions with normal structural MRI has been extensively demonstrated in some neurological conditions. Recently, several authors have characterized the use of MRS imaging in SWS, but they reached somewhat contradicting conclusions. While some authors have detected significant changes only related to N-acetyl-aspartate (NAA), a compound commonly associated with neuronal integrity,9 others have reported choline abnormalities as well, a marker of myelin breakdown.10-12 Another report on a single patient failed to demonstrate any NAA change at all.13 These discrepancies could be attributed, at least partially, to the limited number of cases included in each study. In addition, these previous studies did not explicitly address the issue whether the frontal lobe, which is often spared by the vascular malformation, presents abnormalities on MRS. This is a clinically important issue, since motor impairment, which is one of the most feared complications beside seizures, could become more severe as the frontal lobe is progressively involved in the disease process. This study was designed to evaluate changes on MRS imaging (MRSI) of the two main metabolites (NAA and choline) in posterior brain regions affected by the angioma as well as in the frontal lobe, which was less involved or appeared to be spared based on structural MRI. We correlated these MRS variables to clinical data, including seizure variables, as well as motor function in a prospective series of children with unilateral SWS who underwent MRI/MRSI studies.
Methods
Study Population
Sixteen children (7 boys, mean age + SD = 5.2 + 3 years, range: .9-10.4 years) with the clinical diagnosis of SWS and unilateral hemispheric involvement, based on postcontrast MRI and FDG PET were prospectively included in this study between July 2003 and December 2006. All patients presented with a pial angioma extending over the parietal and/or occipital lobe, with variable additional involvement of other lobes. The frontal lobe was also involved in 8 cases on contrast-enhanced MRI (Table 1). All protocols were approved by the Human Investigation Committee at Wayne State University, and a written informed consent of the parent or guardian was obtained.
MR/MRS Image Acquisition and Analysis
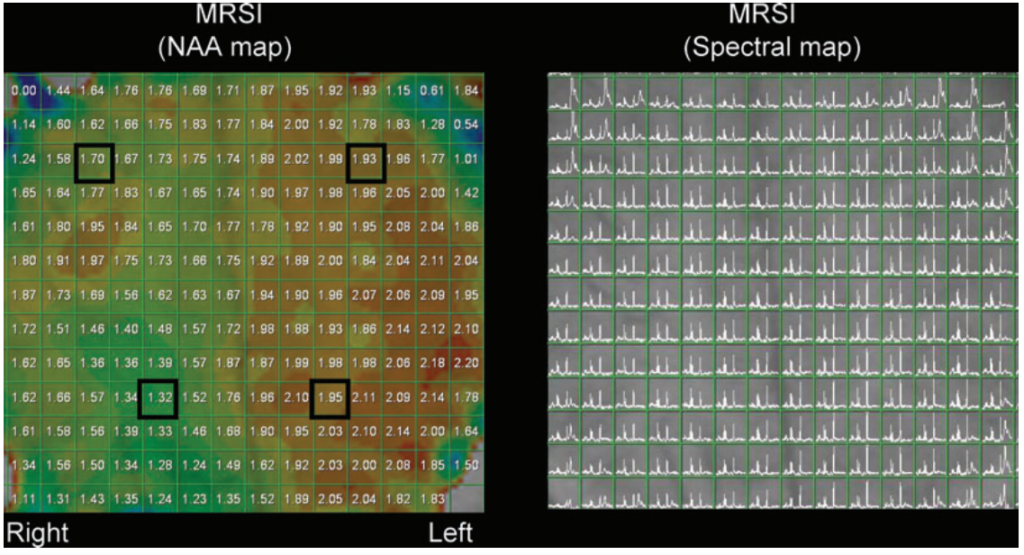
All MRI/MRS studies were performed in a Siemens Sonata 1.5 Tesla whole-body clinical imager (CTI/Siemens, Erlangen, Germany) using a standard head coil. Subjects fasted for 6 hours prior to scanning. Children < 7 years old were sedated with nembutal (3 mg/kg), followed by fentanyl (1 μg/kg). All spectra were acquired using a standard 2D PRESS pulse sequence with the volume of interest (VOI) including some scalp regions in order to acquire more potential samples of gray matter even though that would represent a potential source of lipid contamination. This potential contamination from lipid signals in the scalp was diminished with four out-volume presaturation (OVP) pulses. Each OVP consisted of a 2.56 ms sinc pulse with a fixed bandwidth of 3,400 Hz, a variable gradient pulse in the presaturation slice direction, followed by strong spoiling gradients. OVP could be turned on or off as needed. To improve sampling efficiency and reduce the relatively long acquisition associated with conventional MRSI, a weighted elliptical k-space sampling scheme was used to acquire the MRSI data set.14,15 The weighted k-space sampled only the points located on or within the k-space ellipse. When the number of averages (NA) was greater than 1, the central points of k-space were measured NA times and points on the boundary of the ellipse at least once. For intermediate points, the sampling frequency was determined by their radial distance from the center of k-space. This incorporated the Hamming filter during the measurement, resulting in an improved signal-to-noise ratio (SNR) per measurement time of approximately 20% on a phantom test.14,15 Sample of voxels and quality of spectra are shown in Figure 1. After automatically shimming, which took typically 2 minutes and achieved about 22 Hz line width at the half height of the water peak, MRSI spectra were acquired in a plane passing through the parietal and frontal lobes above the level of the thalamus, including region(s) showing leptomeningeal angioma on previous and current MRI scans. In some patients additional MRSI planes were also placed just below and/or above the initial plane, and the optimal plane, showing maximal pial enhancement, was selected for analysis offline. Since acquisition of each MRSI plane lasted 12-15 minutes (including shimming) even with an elliptical k-space sampling, we intended to keep the number of acquired planes to the minimum in order to limit sedation time for the children. Typical measurement parameters were: field of view (FOV) = 200 × 200 mm2; phasing-encoding steps = 24 × 24, TR = 1,280 ms, TE = 280 ms, slice thickness = 15 mm, signal averages = 2, and acquisition time = 10:12 minutes. Data were processed with the Siemens spectral processing package. Data processing consisted of line broadening (Gaussian function with 256 ms), standard fast Fourier transformations, and phasing. No baseline correction was applied due to long TE. Metabolite integrals were obtained automatically with spectral fitting using the Siemens spectroscopy software package and were used for all analyses. Several precautions were taken to reduce potential errors in analysis, including discarding spectra from the edge of the VOI, and extracting information only from voxels that were wholly within the desired areas by taking the advantage of the voxel-shifting capability of MRSI. In addition to MRS acquisition, a standard axial pregadolinium T1, T2 and susceptibility weighted imaging (SWI) as well as postgadolinium axial T1 images were acquired in all cases. Compounds studied in the MR spectra were cholinecontaining molecules at 3.2 ppm and N-acetyl-aspartate at 2.0 ppm; finally metabolic maps were generated. Choline and NAA values from at least three adjacent voxels belonging to predominantly gray matter or predominantly white matter from a particular lobe were averaged. Abnormalities of NAA and choline on the side of the angioma were quantified by dividing the average NAA and choline values ipsilateral to the angioma by those in the contralateral homotopic region, thus yielding an asymmetry ratio for each region (posterior and frontal, both for gray and white matter, separately). Metabolite asymmetries, rather than absolute values were used to eliminate the effect of age,16 which could have confounded disease-related abnormalities in this pediatric group with a relatively wide age range. To sample the posterior region with angioma, we sampled voxels from the parietal lobe in 14 cases and from the occipital lobe in the remaining two.
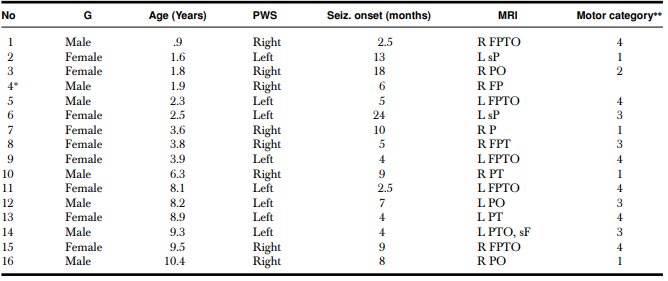
The table shows gender, age, location of port wine stain, lobes involved by angioma on MRI, and motor category. G = gender; PWS = port wine stain location; R = right; L = left; T = temporal; F = frontal; O = occipital; P = parietal; s = superior.
∗Child was not able to follow the instructions during the motor assessment and, therefore, did not provide a motor score.
**Purdue and Grooved Pegboard T-scores. (1) T-score within 2 SDs of the normative mean (>30); (2) between 2 and 3 SDs below the normative mean (between 20 and 30); (3) >3 SDs below the normative mean (<20); and (4) child unable to place pegs and thus cannot be scored due to paresis.
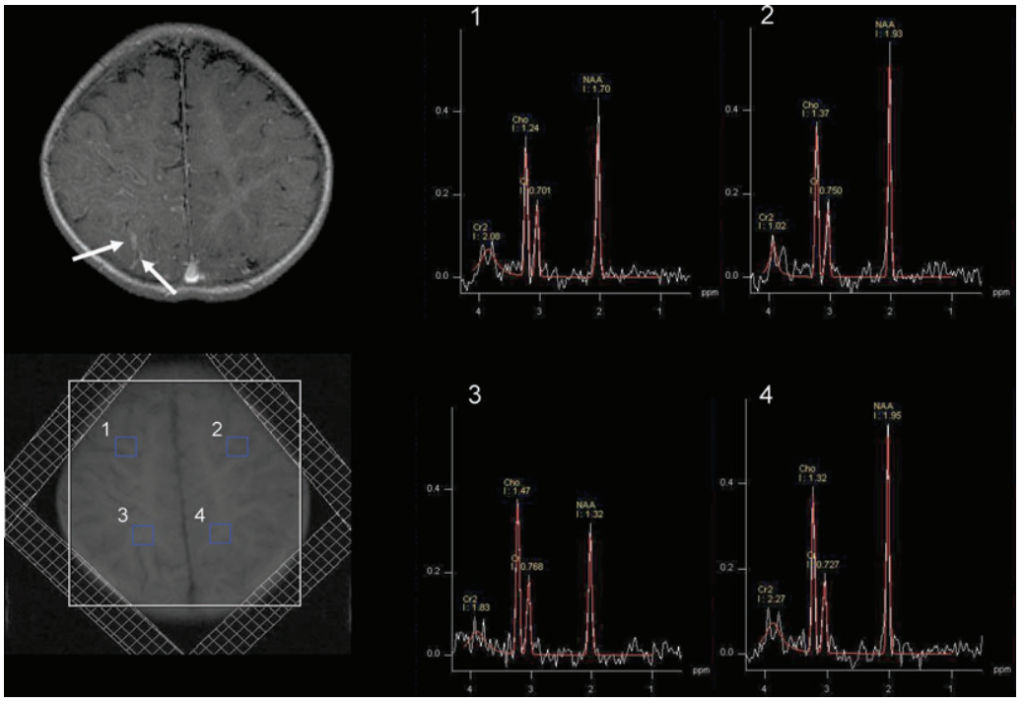
lipid contamination particularly from the scalp, outer voxels were excluded. At least 3 adjacent voxels belonging to predominantly gray matter or predominantly white matter from a particular lobe were averaged. The upper spectra (1 and 2) were obtained from the frontal lobe gray matter, which showed decreased NAA on the right side as compared to the left. The lower spectra (3 and 4) were obtained from the parietal lobe white matter also demonstrating decreased NAA on the right side as compared to the left side.
Neuropsychological Testing
Motor and intellectual functioning were assessed via neuropsychological evaluation by licensed neuropsychologists (MB and EH) who were blind to all neuroimaging results. Purdue Pegboard was used to assess manual dexterity in children below 5 years of age, and Grooved Pegboard to assess motor function in participants above 5 years. The motor assessment yielded a standardized motor T-score, which was categorized as follows: (1) T-score within 2 SDs of the normative mean (T-score >30); (2) between 2 and 3 SDs below the normative mean (between 20 and 30); (3) >3 SDs below the normative mean; and (4) child unable to place pegs and thus cannot be scored due to paresis. One child (patient 14, Table 1) was unable to follow the instructions for the task and was not included in analyses involving motor data.
Assessment of Seizure Variables
Two seizure-related variables were calculated: age at seizure onset, which was defined by the age at the first seizure episode reported by the parents or legal guardians; duration of epilepsy, defined by the difference between age at MRI scanning and age at seizure onset.
Study design and statistical analysis
Statistical analysis was performed using SPSS version 11.5 (SPSS Inc, Chicago, IL, USA). First, NAA and choline asymmetry ratios (ipsilateral/contralateral to the angioma) were compared between the posterior and frontal lobe regions using paired t-tests. Subsequently, age and MRSI values between children with frontal lobe involvement on structural MRI versus those with no apparent frontal lobe involvement (no leptomeningeal enhancement, no signs of evident atrophy, or any other structural abnormality on conventional MRI, as evaluated by two of the authors who were not aware of the MRS findings at the time of the assessment) were compared, using unpaired t-tests. To determine if clinical seizure variables (age at seizure onset, duration of epilepsy) correlate with MRSI variables, Pearson’s correlations were performed, and the P values were corrected for multiple comparisons using the Bonferroni method. In addition, to find predictors of motor functions, Spearman’s correlations were performed with age, clinical seizure variables, and MRSI variables as potential predictors and motor categories as the outcome. Subsequently, significant predictors (corrected for multiple comparisons) in these correlations were entered in an ordinal regression analysis to identify independent predictors of motor function. P values less than .05 (after correction for multiple comparisons, where applicable) were considered to be significant. In addition to group analyses, individual patients with abnormal NAA and/or choline were identified when these values showed ≥10% asymmetry between ipsi- and contralateral homotopic regions. This cutoff threshold was selected based on previous reports showing that NAA and choline values show less than 10% asymmetry in various brain regions in both adult and pediatric populations.16,17
Results
NAA and choline abnormalities in the anterior versus posterior region: In the whole group, NAA asymmetry values in the gray and white matter were lower in the posterior region compared to the frontal lobe, although the difference did not reach significance (.81 + .17 vs. .89 + .12, for gray matter, P = .1; .89 + .15 vs. .95 + .13, for white matter, P = .3). Also, choline asymmetries showed no significant difference between the posterior and frontal regions (gray matter: posterior 1.21 + .3 vs. frontal 1.16 + .33; white matter: posterior 1.07 +.19 vs. frontal 1.06 + .17; P > .5).
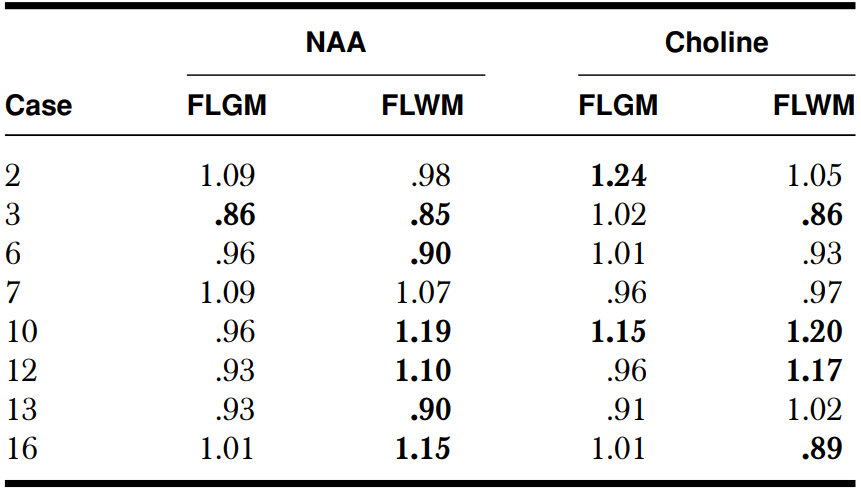
Frontal lobe metabolite abnormalities in patients with versus without frontal lobe involvement on structural MRI : Eight children showed frontal lobe abnormalities on structural MRI. The mean age of this group (5.0 + 3.5 years) was similar to those without frontal MRI abnormalities (5.4 + 3.5 years; P = .8). Children with frontal lobe involvement on structural MRI had significantly lower level of NAA (reflected by lower NAA asymmetry ratios) in both frontal lobe gray and white matter when compared to patients without frontal MRI involvement (gray matter: .79 + .08 vs. .97 + .08, respectively, P < .001; white matter: .87 + .1 and 1.01 + .13, respectively, P = .03). Frontal choline asymmetries were not significantly different between the two subgroups, despite higher mean frontal choline asymmetry ratios in patients with frontal lobe involvement (gray matter: 1.29 + .43 vs. 1.03 + .11; P = .12; white matter: 1.12 + .2 vs. 1.01 + .12 P = .2). Individual frontal lobe NAA values were all lower on the angioma side in patients with frontal involvement on structural MRI, with at least 10% decrease in the gray matter in all but one case ( which showed a 9% decrease), and half of these patients presented at least 10% NAA decrease in the white matter (Table 2). In patients with no frontal lobe involvement on structural MRI, a ≥10% NAA decrease was seen in 3 patients (1 in both in the gray and white matter, 2 in the white matter only) (see example on Figures 1 and 2); however, ≥10% increase of frontal NAA values was found in 3 other children (all in white matter) (Table 3). Individual frontal lobe choline values showed abnormal increase in 4 patients (3 in both gray and white matter and 1 in gray matter only) in the subgroup with abnormal frontal lobe on MRI (Table 2), and in 3 patients with normal frontal lobe on structural MRI (1 in both gray and white matter, 1 in gray matter only, and 1 in white matter only) (Table 3). Two patients had a ≥10% decrease of frontal lobe choline in the same subgroup. Altogether, all but 1 child with normal frontal lobe on conventional MRI showed abnormal NAA and/or choline values in the frontal lobe.
MRSI and clinical variables: NAA asymmetry in the frontal lobe gray and white matter correlated with motor function (r = – .89; P < .001 and r = – .80; P = .03, respectively, after Bonferroni correction), that is, lower NAA in the frontal lobe was associated with more severe motor impairment. When we analyzed only those patients with no frontal lobe involvement on conventional MRI (n = 8), a similar correlation between NAA gray matter and motor function was found, which was only significant without correction for multiple comparisons (r = – .86, P = .04). In contrast, frontal choline asymmetries did not show significant correlation with motor functions (r = .46 and r = .36, for gray and white matter respectively, P > .1). There was no correlation between motor function and any metabolite measured in the posterior region. Among the clinical seizure variables, age at seizure onset correlated with motor categories (r = – .67, P = .009), indicating poorer motor functions in children with earlier onset of seizures. Also, NAA asymmetry in the frontal lobe gray matter showed a positive correlation with the age of seizure onset (r = .76; P = .04 after correction), indicating lower NAA values in children with early onset of seizures. Age and duration of epilepsy did not correlate with motor functions (age: r = .25, P = .81; duration: r = .37, P = .62) or any of the MRSI variables (corrected P > .1 for all correlations). Therefore, a subsequent ordinal regression analysis was performed with age at seizure onset and frontal lobe gray matter NAA asymmetries entered as predictors, and motor category as the outcome variable. This analysis showed that only frontal lobe NAA asymmetry (P = .01) but not age at seizure onset (P = .6) was an independent predictor of motor functions.
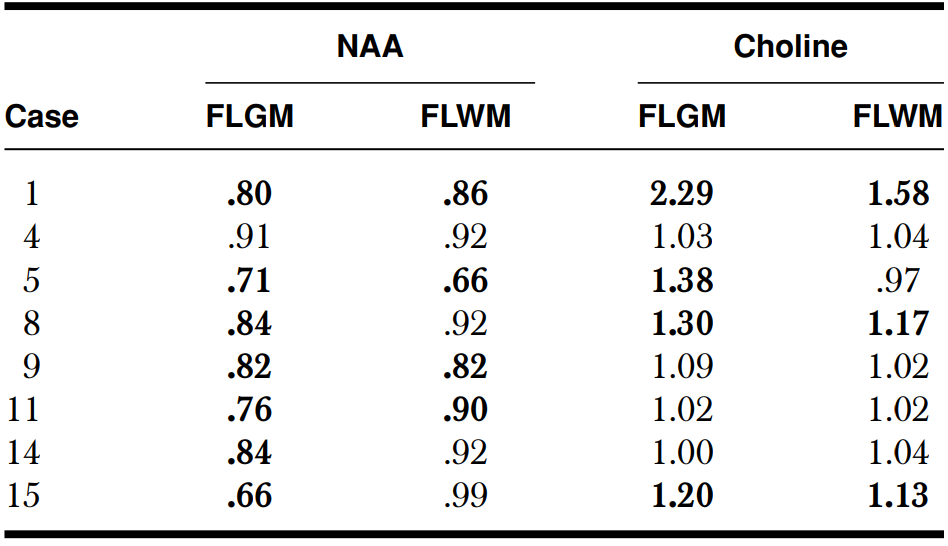
Abnormal ratio (bolded values) was defined as a > 10% difference between ipsilateral and contralateral sides. FLGM = Frontal lobe gray matter; FLWM = Frontal lobe white matter
Abnormal ratio (bolded values) was defined as a > 10% difference between ipsilateral and contralateral sides. FLGM = Frontal lobe gray matter; FLWM = Frontal lobe white matter
Discussion
This study represents the largest series to date where MRSI was employed to analyze cerebral biochemical changes in children with SWS. The results show that in addition to an almost universal abnormality of NAA and choline compounds in the posterior regions, which show angiomatous involvement, these metabolites are also often abnormal in the frontal lobe even in patients with no apparent structural abnormality detected by conventional MRI in this region. Furthermore, the severity of frontal NAA abnormalities appears to be a strong, independent predictor of motor functions. Methodological considerations: Proton MRS represents a noninvasive technique for the assessment of certain brain metabolites in a variety of neurological disorders.18 This technique, however, carries some limitations: First, despite applying MRS imaging, this technique is currently not able to provide a true 3-dimensional analysis of the entire brain volume, but it is more amenable to studies targeting specific brain regions. In this study, we focused on the frontal lobe, which is often less or not at all involved on conventional MRI in children with SWS. In addition, the size of the individual voxels is relatively large, thus the signal from a surrounding area can affect the metabolite profile in a particular voxel. In order to diminish this effect, we carefully selected voxels that were almost completely covering gray or white matter regions, excluding regions near the ventricles or subcortical structures (thalamus and basal ganglia). Still, there were several voxels with a mixture of gray and white matter, although with predominance of one or the other. Correction for gray matter/white matter content was not applied, but we have averaged a number (at least 3) adjacent voxels to represent the given region. Since the location of pial angiomas is individually variable, we carefully selected the MRSI planes to pass through the middle of the angioma region. The normalization procedure that was used in this article also deserves discussion. Since absolute quantification of brain metabolites is difficult to perform accurately, several centers use a ratio of one metabolite to another.8 Instead of metabolite ratios, we employed ipsilateral/contralateral ratios of NAA and choline values. This could be done because all of our patients had unihemispheric involvement (based on postcontrast MRI and glucose PET), thus, the contralateral hemisphere could be reasonably used as an internal control, therefore eliminating age effects. The only exception could be the contralateral occipital cortex, which may show increased glucose metabolism on PET in some patients with unilateral SWS and severe ipsilateral occipital hypometabolism, perhaps due to reorganizational changes.19 However, occipital lobe was included in this analysis only in 2 patients, and none of them showed occipital increase of glucose metabolism on their FDG PET scan. Finally, we did not have a normal control group to establish a cutoff threshold for abnormal asymmetries. Indeed, it would be difficult to obtain age-matched normative date for such a young patient population, since healthy young children would require sedation for lengthy MRSI acquisitions. Therefore, we used a 10% asymmetry threshold based on previous studies indicating that normal asymmetries are well below this value for the analyzed metabolites.16,17 Spectroscopic abnormalities of frontal lobe in patients with normal structural MRI : Most patients whose frontal lobes were normal on visual inspection of contrast-enhanced MRI showed abnormal NAA and/or choline values in the frontal lobe ipsilateral to the angioma. It is well known that spectroscopic abnormalities may precede structural MRI changes in various neurological disorders.18 A previous study, for example, identified abnormal brain areas by MRSI in patients with systemic lupus erythematosus and concluded that MRSI abnormalities may predict future parenchymal damage.20 In patients with SWS, decreased NAA may suggest neuronal damage while increased choline can occur in regions undergoing myelin breakdown, which may be due to demyelination in areas under hypoperfusion stress.21 Altogether, the observed changes may represent an early sign of neuronal and myelin injury in some patients with SWS and, perhaps, guide early intervention. A longitudinal study may confirm this hypothesis. An unexpected finding was a ≥10% increase of NAA content in the ipsilateral frontal lobe in 3 children with no structural abnormality on conventional MRI. Increased NAA has been reported in patients with malformations of cortical development, both in MRI-visible lesions and in peril-lesional areas normal on conventional MRI.22 Increased NAA in white matter (seen in 3 of our subjects) may represent increased neuronal content, perhaps due to microscopic heterotopic lesions. It has been previously suggested that microvascular abnormalities during brain development may arrest or disturb normal hemispheric development in children with SWS, thus leading to abnormal neuronal migration or cortical organization, which can manifest as a malformation (such as pachygyria) on MRI.23 Correlation between clinical and spectroscopic findings: A previous study described a trend between NAA/Creatine ratio and the degree of hemiparesis in a small set (n = 6) of patients with SWS.10 Our study indicates a strong association between decreased frontal lobe NAA and motor deficit. Similar correlations have been described in other cerebral vascular disorders. For example, a longitudinal study of stroke patients suggested that NAA levels may predict motor outcome in those patients.24 In another study, patients with motor neuron disease and reduced NAA values had more severe motor deficit.25 The same group later expanded these observations into a longitudinal study, and concluded that metabolite changes, including NAA, could aid detection of early stages and monitor disease progression.26 In this study, even those patients whose structural MRI did not show pial enhancement in the frontal lobe (n = 8), presented a correlation between NAA and motor function. Although the number of cases was limited, this relationship suggests early, clinically relevant disease involvement of the frontal lobe in those patients. A longitudinal study could answer whether those children progress to a more severe stage of motor involvement than children who do not show MRSI abnormalities in frontal lobe. With regard to seizure variables, early age of seizure onset was associated with lower frontal gray matter NAA values. Previous studies in other epileptic conditions have found a similar association between the degree of brain damage and age of seizure onset. For example, previous morphological and MR volumetric studies in patients with temporal lobe epilepsy demonstrated more severe hippocampal damage in patients with early onset seizures.27,28 Such data suggest that younger patients may be more susceptible to seizure-induced damage than older individuals. In SWS, progressive brain damage can also be the result of chronic hypoxia due to the vascular malformation. In support of this hypothesis, our recent study, which employed positron tomography scanning, found that progressive metabolic changes in SWS tend to occur at early ages (before 3-4 years of age),29 coinciding with a robust developmentally regulated increase of metabolic demand. On the other hand, we did not find a correlation between duration of epilepsy and MRSI abnormalities. This is not surprising, because pathophysiological changes in SWS may start before the onset of the first clinical seizure, as demonstrated by abnormal blood flow studies in children before onset of epilepsy.30 In addition, other seizure-related factors, such as frequency or severity of seizures (which are difficult to estimate accurately) may affect progression of metabolic and structural brain abnormalities, thus confounding the effect of time since the onset of first seizure.31,32 Whether frontal damage in SWS detected by MRSI occurs early at disease onset or develops later due to repeated ischemic and/or seizure episodes, needs to be further investigated. In conclusion, MRS imaging may be a useful complementary imaging tool for assessment of patients with SWS, particularly to address frontal lobe involvement in children who show no apparent structural abnormalities in the frontal lobe on conventional MRI. Early detection of frontal lobe damage in such children may facilitate early interventions (such as intense physiotherapy or timely presurgical evaluation if seizures remain uncontrolled) to minimize neurocognitive consequences of the disease.
References
1. Bebin EM, Gomez MR. Prognosis in Sturge-Weber disease: comparison of unihemispheric and bihemispheric involvement. J Child Neurol 1988;3:181-184.
2. Thomas-Sohl KA, Vaslow DF, Maria BL. Sturge -Weber syndrome: a review. Pediatr Neurol 2004;30:303-310.
3. Roach ES. Neurocutaneous syndromes. Pediatr Clin North Am 1992;39:591-620.
4. Dilber C, Tasdemir HA, Dagdemir A, Incesu L, Odaci E. SturgeWeber syndrome involved frontoparietal region without facial nevus. Pediatr Neurol 2002;26:387-390.
5. Marti-Bonmati L, Menor F, Mulas F. The Sturge-Weber syndrome: correlation between the clinical status and radiological CT and MRI findings. Childs Nerv Syst 1993;9:107-109.
6. Chugani HT, Mazziotta JC, Phelps ME. Sturge-Weber syndrome: a study of cerebral glucose utilization with positron emission tomography. J Pediatr 1989;114:244-253.
7. Lee JS, Asano E, Muzik O, Chugani DC, Juhasz C, Pfund Z, Philip S, Behen M, Chugani HT. Sturge-Weber syndrome: correlation between clinical course and FDG PET findings. Neurology 2001;57:189-195.
8. Rudkin TM, Arnold DL. Proton magnetic resonance spectroscopy for the diagnosis and management of cerebral disorders. Arch Neurol 1999;56:919-926. 9
. Moore GJ, Slovis TL, Chugani HT. Proton magnetic resonance spectroscopy in children with Sturge-Weber syndrome. J Child Neurol 1998;13:332-335.
10. Lin DD, Barker PB, Hatfield LA, Comi AM. Dynamic MR perfusion and proton MR spectroscopic imaging in Sturge-Weber syndrome: correlation with neurological symptoms. J Magn Reson Imaging 2006;24:274-281.
11. Cakirer S, Yagmurlu B, Savas MR. Sturge-Weber syndrome: diffusion magnetic resonance imaging and proton magnetic resonance spectroscopy findings. Acta Radiol 2005;46:407-410.
12. Sijens PE, Gieteling EW, Meiners LC, Sival DA, Potze JH, Irwan R, Oudkerk M. Diffusion tensor imaging and magnetic resonance spectroscopy of the brain in a patient with Sturge-Weber syndrome. Acta Radiol 2006;47:972-976.
13. Lin DD, Barker PB, Kraut MA, Comi A. Early characteristics of Sturge-Weber syndrome shown by perfusion MR imaging and proton MR spectroscopic imaging. AJNR Am J Neuroradiol 2003;24:1912-1915.
14. Kuhn B, Dreher W, Norris DG, Leibfritz D. Fast proton spectroscopic imaging employing k-space weighting achieved by variable repetition times. Magn Reson Med 1996;35:457-464.
15. Maudsley A, Matson GB, Hugg JW, Weiner MW. Reduced phase encoding in spectroscopic imaging. Magn Reson Med 1994;31:645- 651.
16. Horska A, Kaufmann WE, Brant LJ, Naidu S, Harris JC, Barker PB. In vivo quantitative proton MRSI study of brain development from childhood to adolescence. J Magn Reson Imaging 2002;15:137- 143.
17. Nagae-Poetscher LM, Bonekamp D, Barker PB, Brant LJ, Kaufmann WE, Horska A. Asymmetry and gender effect in functionally lateralized cortical regions: a proton MRS imaging study. J Magn Reson Imaging 2004;19:27-33.
18. Bonavita S, Di Salle F, Tedeschi G. Proton MRS in neurological disorders. Eur J Radiol 1999;30:125-131.
19. Batista CEA, Juhasz C, Muzik O, Chugani DC, Chugani HT. Increased visual cortex glucose metabolism contralateral to the angioma in children with Sturge-Weber syndrome. Dev Med Child Neurol 2007;49(8):567-573.
20. Castellino G, Govoni M, Padovan M, Colamussi P, Borrelli M, Trotta F. Proton magnetic resonance spectroscopy may predict future brain lesions in SLE patients: a functional multiimaging approach and follow up. Ann Rheum Dis 2005;64:1022- 1027.
21. Falini A, Barkovich AJ, Calabrese G, Origgi D, Triulzi F, Scotti G. Progressive brain failure after diffuse hypoxic ischemic brain injury: a serial MR and proton MR spectroscopic study. AJNR Am J Neuroradiol 1998;19:648-652.
22. Woermann FG, McLean MA, Bartlett PA, Barker GJ, Duncan JS. Quantitative short echo time proton magnetic resonance spectroscopic imaging study of malformations of cortical development causing epilepsy. Brain 2001;124:427-436.
23. Portilla P, Husson B, Lasjaunias P, Landrieu P. Sturge-Weber disease with repercussion on the prenatal development of the cerebral hemisphere. AJNR Am J Neuroradiol 2002;23:490-492.
24. Kobayashi M, Takayama H, Suga S, Mihara B. Longitudinal changes of metabolites in frontal lobes after hemorrhagic stroke of basal ganglia: a proton magnetic resonance spectroscopy study. Stroke 2001;32:2237-2245.
25. Rooney WD, Miller RG, Gelinas D, Schuff N, Maudsley AA, Weiner MW. Decreased N-acetylaspartate in motor cortex and corticospinal tract in ALS. Neurology 1998;50:1800-1805.
26. Suhy J, Miller RG, Rule R, Schuff N, Licht J, Dronsky V, Gelinas D, Maudsley AA, Weiner MW. Early detection and longitudinal changes in amyotrophic lateral sclerosis by (1)H MRSI. Neurology 2002;58:773-779.
27. Trenerry MR, Jack CR Jr, Sharbrough FW, Cascino GD, Hirschorn KA, Marsh WR, Kelly PJ, Meyer FB. Quantitative MRI hippocampal volumes: association with onset and duration of epilepsy, and febrile convulsions in temporal lobectomy patients. Epilepsy Res 1993;15:247-252.
28. Davies KG, Hermann BP, Dohan FC Jr, Foley KT, Bush AJ, Wyler AR. Relationship of hippocampal sclerosis to duration and age of onset of epilepsy, and childhood febrile seizures in temporal lobectomy patients. Epilepsy Res 1996;24:119-126.
29. Juhasz C, Batista CE, Chugani DC, Muzik O, Chugani HT. Evolution of cortical metabolic abnormalities and their clinical correlates in Sturge-Weber syndrome. Eur J Paediatr Neurol 2007 doi:10.1016/j.ejpn.2007.02.001.
30. Pinton F, Chiron C, Enjolras O, Motte J, Syrota A, Dulac O. Early single photon emission tomography in Sturge-Weber syndrome. J Neurol Neurosurg Psychiatry 1997;63:616-621.
31. Garcia PA, Laxer KD, van der Grond J, Hugg JW, Matson GB, Weiner MW. Correlation of seizure frequency with N-acetyl-aspartate levels determined by 1 H magnetic resonance spectroscopic imaging. Magn Reson Imaging 1997;15:475- 478.
32. Burneo JG, Knowlton RC, Faught E, Martin R, Sawrie S, Kuzniecky RI. Chronic temporal lobe epilepsy: spatial extent and degree of metabolic dysfunction studied with magnetic resonance spectroscopy (MRS). Epilepsy Res 2004;62:119-124.