Originally Authored by Michael Behen, Harry T. Chugani, Csaba Juasz, Emily Helder, Albert Ho, Mohsin Maqbool, Robert D. Rothermel, Jacquie Perry, and Otoo Muzik in Movement Disorders
Abstract
Symptoms in Tourette syndrome (TS) are likely related to abnormalities involving multiple neurotransmitter systems in striatal-thalamo-cortical circuitry. Although prior studies have found abnormal levels of tryptophan, serotonin, and their metabolites in blood, cerebrospinal fluid and brain tissue of TS patients, understanding of focal brain disturbances and their relationship to clinical phenotype remains poor. We used a-[11C]methyl-L-tryptophan (AMT) positron emission tomography (PET) to assess global and focal brain abnormalities of tryptophan metabolism and their relationship to behavioral phenotype in 26 children with TS and nine controls. Group comparisons on regional cortical and subcortical AMT uptake revealed decreased AMT uptake in bilateral dorsolateral prefrontal cortical and bilaterally increased uptake in the thalamus (P = 0.001) in TS children. The ratio of AMT uptake in subcortical structures to dorsolateral prefrontal cortex was significantly increased bilaterally (P < 0.01) in TS patients also. Behaviorally defined subgroups within the TS sample revealed differences in the pattern of AMT uptake in the fronto-striatal-thalamic circuit. This study demonstrates cortical and subcortical abnormalities of tryptophan metabolism in TS and provides neuroimaging evidence for a role of serotonergic mechanisms in the pathophysiology of TS.
Keywords: Tourette syndrome, neuroimaging, positron emission tomography (PET), fronto-striatal-thalamic circuit, neuropsychology, serotonin
Introduction
Tourette syndrome (TS) is a neuropsychiatric disorder characterized by motor and vocal tics, and is commonly associated with neuropsychological deficits (e.g., visuomotor integration) and comorbid conditions such as obsessive-compulsive disorder (OCD) and attention-deficit hyperactivity disorder (ADHD).(1) The pathophysiology of TS is postulated to involve a dysfunction of corticostriatal-thalamic circuitry,(2) which is supported by metabolic imaging studies.(3,4)
Although previous imaging data favor an important role of the dopaminergic system in TS symptomatology,(5) in vivo studies indicate that serotonergic abnormalities may also be important. Researchers have reported decreased blood levels of tryptophan in patients with TS compared to controls,(6,7) demonstrated that levels of tryptophan in cerebrospinal fluid were inversely related to tic severity in TS subjects,(8) and found that levels of the serotonin metabolite 5-HIAA in cerebrospinal fluid were decreased in TS subjects following probenecid loading.(9) In a study of postmortem brains from TS subjects, Anderson et al.(10) reported decreased levels of serotonin and its metabolite 5-HIAA in a number of subcortical regions. Altogether, these data strongly suggest that abnormal tryptophan metabolism may play a role in the pathophysiology of TS.
In vivo studies of the serotonin system in TS have included single photon emission computed tomography (SPECT) studies to investigate serotonin transporter binding (SERT) in TS, finding reduced SERT availability in TS patients.(11,12) Elevated 5-HT2A receptor binding in adults with TS has also been found.(13) These studies support a relationship between TS and serotonergic neurotransmission; however, the relationship of these findings to tics and/or behavioral phenotype remains unclear.
Previously, there has been no direct method of imaging and measuring cerebral serotonin metabolism in the human brain. With the development of the new tracer -[11C]methyl-L-tryptophan (AMT) and the use of positron emission tomography (PET),(14,15) it is now possible to image and measure tryptophan metabolism in TS patients. Changes in global and regional AMT uptake may closely reflect altered serotonin synthesis in the brain, although increased AMT uptake may also occur under specific conditions (such as inflammation) where tryptophan metabolism is induced via the kynurenine pathway.(16 )
In this study, we sought to investigate whether TS subjects manifest abnormal brain tryptophan metabolism as compared to controls, and further, whether such abnormalities were associated with tics and behavioral phenotype. We hypothesized that TS subjects would show abnormal regional tryptophan metabolism in fronto-striatal-thalamic circuitry, and that the pattern of functional abnormality would be associated with tic severity and behavioral phenotype.
Subjects and methods
Twenty-six children (19 males, mean age 11.3 years; SD 3.0; age range: 5.7–18 years) with TS and nine controls underwent AMT PET scans. All TS participants were diagnosed by a pediatric neurologist. The control group consisted of nine siblings of autistic children (mean age: 10.1 years, age range: 8 –15 years).(17) None of the controls were taking medication prior to the study, and none had current or historical diagnoses of neurological or psychiatric disorder. Given that these children were siblings of children with autism, presumably an inherited disorder, all were assessed for the presence of autistic symptoms as well as for behavioral problems. None of the controls had significant elevations on any of the subscales of the measures used.(17) Age was not significantly different between the groups (P 0.27).
Nine of the 26 TS patients were taking medication for TS or associated symptoms at the time of enrollment in the study, while an additional 9 patients had taken medication at some point prior to involvement in the study. In order to control for medication effects on AMT PET data, participants were placed into the following groups: no medications (n 8), use of psychoactive medication including SSRIs (n 7), and use of other psychoactive medications (n 11).
All patients discontinued their medications 4 weeks before their scheduled PET scan. Eleven patients were given sedation because they could not remain still during the PET scan; 10 oral diazepam, and 1 intravenous nembutal followed by fentanyl. This study was conducted with approval from Wayne State University Human Investigations Committee and written informed consent was obtained from all participants prior to enrollment in the study.
Assessment of tics, OCD, and ADHD comorbidity
Assessment of tics involved administration of the Tic Symptom Self-Report (TSSR) measure.(18) The TSSR is a caregiver-report measure that assesses the type and severity of motor and vocal tics over the past week. The motor and vocal scores are composited into an overall tic severity score, which was used as the index of tic severity for the present study. OCD symptoms were quantified via semistructured interview (Children’s Yale-Brown Obsessive Compulsive Scale).(19) The operational definition for OCD in this study required a CYBOCS total score of >15 (Ref. 20) and current diagnosis of OCD, according to DSM-IV-TR criteria. ADHD comorbidity was defined as current diagnosis of ADHD, as well as clinically significant elevation on the Attention Problem scale of the Behavioral Assessment Scale for Children (BASC). The above measures have been demonstrated to be psychometrically sound instruments.(18,19,21)
Four TS subgroups were identified: no comorbid diagnosis (“Pure” TS, n 11), OCD comorbid (OCD, n 6), ADHD comorbid (ADHD, n 6), and a group comorbid for both OCD and ADHD (n 3). Given the small number of patients in the latter group, it was dropped from further comparisons between subgroups. Participants underwent comprehensive neuropsychological evaluations. TS subgroups differed only on internalizing (OCD> Pure, ADHD; P 0.000) and externalizing (ADHD> Pure, OCD; P 0.000) behavioral problems. Subgroups did not differ on age or tic severity.
AMT PET Procedure
PET studies were performed using the CTI/Siemens EXACT/HR whole-body positron tomograph (Knoxville, TN) located in the Children’s Hospital of Michigan, Detroit. The scanning protocol used in the present study has been reported previously.(22) In order to avoid erroneous asymmetries due to image tilt, all image volumes were resliced using a multipurpose 3D-registration technique (MPItool).(23)
Image analysis
Since all subjects received a standardized dose based on their weight (0.1 mCi/kg), the averaged AMT images (uCi/cm3 ) directly depict the standard uptake value (SUV).(15) Brain regions of interest (ROIs) were manually defined on PET images, by a rater blind to diagnoses and hypotheses, in both hemispheres for one cortical region (DLPF) and three subcortical structures (thalamus, caudate, and lentiform nucleus). The average concentration for each ROI was obtained as a weighted average over all planes showing a particular region/structure. Additionally, a whole brain ROI was defined including all supratentorial planes and used to normalize regional SUVs to whole brain SUV. This procedure resulted in normalized SUVs for DLPF, thalamus, caudate, and lentiform nucleus. In order to study the relationship between subcortical and cortical AMT tracer uptake, we divided tracer concentration in the thalamus, caudate, and lentiform nucleus by concentration determined for the DLPF. This resulted in a subcortical to cortical ratio (SCR) for the thalamus, caudate and lentiform nucleus. Finally, an asymmetry index (AI) was calculated for each region/ structure as follows: AI (%) (L R)/[(L R)/2] 100%, where L represents normalized SUVs in the left hemisphere and R in the right hemisphere.
Statistical analysis
Initial analyses evaluated between-group differences for medication use/type (one-way ANOVAs) and sedated versus nonsedated (independent samples t-test) patients on AMT PET variables, to determine whether it was necessary to control for medication use/type and/or sedation in subsequent analyses.
Whole brain SUV was compared between the TS group and controls using a univariate ANCOVA, controlling for age. To investigate group differences between patients and controls on regional normalized SUVs and SCRs, two separate 2 (group) 4 (region) 2 (side) repeated measures ANCOVAs, controlling for age, were performed. Simple effects tests were examined following significant two or three way interaction(s). To evaluate differences on normalized SUVs between TS subgroups, a 3 (group) 4 (region) 2 (side) repeated measures ANCOVA was applied controlling for tic severity. Again, simple effects tests followed significant interactions. To examine the association of tic severity to regional normalized SUVs and AIs, we applied Pearson correlations.
Given that the above mixed-model ANCOVAs design includes some statistical control for multiple comparisons,(24) we did not apply any correction to main effects or interactions; interactions were examined further if significant at P 0.05. However, the between-group comparison on whole brain SUV and correlations between tic severity and normalized SUVs and AIs were adjusted using Bonferroni correction for multiple comparisons in order to reduce the likelihood of Type I error. Since there were 13 tests the significance level for these analyses was 0.004.
Results
Whole brain AMT uptake, effect of medication, and sedation
There were no differences between the medication groups or sedation groups on whole brain AMT SUV, normalized regional values, or cortical ratios. Therefore, medication effect and use of sedation were not included as covariates for comparisons on AMT PET variables.
The overall univariate ANCOVA for mean SUV for the whole brain was not significant although there was a trend for reduced uptake in TS (P 0.02).
Differences in regional AMT uptake and subcortical-cortical ratios between TS patients and controls
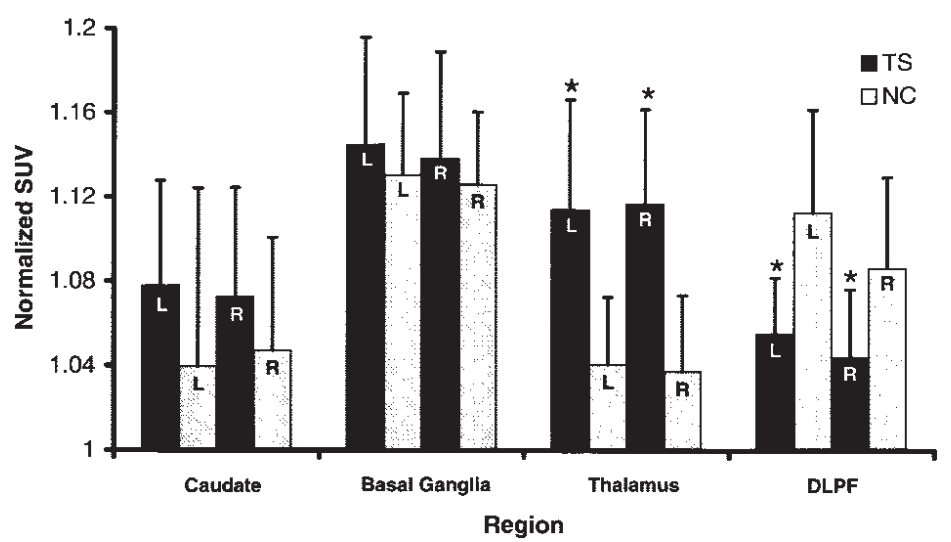
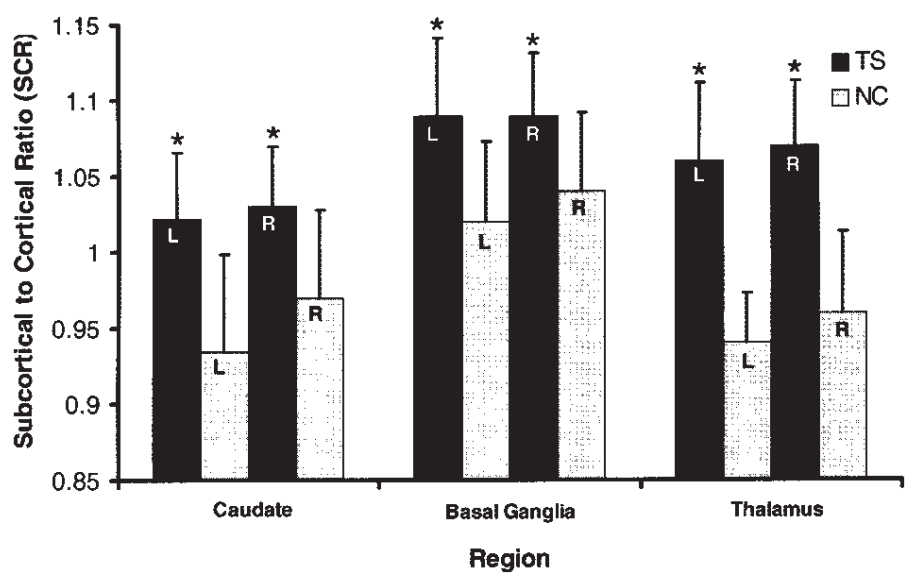
The group region interaction for regional AMT SUV was significant (P 0.000). Simple effects tests showed that TS patients had significantly reduced normalized SUVs in the bilateral DLPF (left P 0.001; right P 0.001) and increased normalized SUVs in the bilateral thalamus (left P 0.001; right P 0.000) (Fig. 1). For SCRs, the group region interaction (P 0.00) was significant. Simple effects tests showed higher SCRs in the bilateral thalamus (left P 0.000; right P 0.000), bilateral caudate (left P 0.000; right P 0.002) and bilateral lentiform nucleus (left P 0.002; right P 0.008) (Fig. 2) in TS patients.
Differences in regional AMT uptake between behaviorally defined TS subgroups
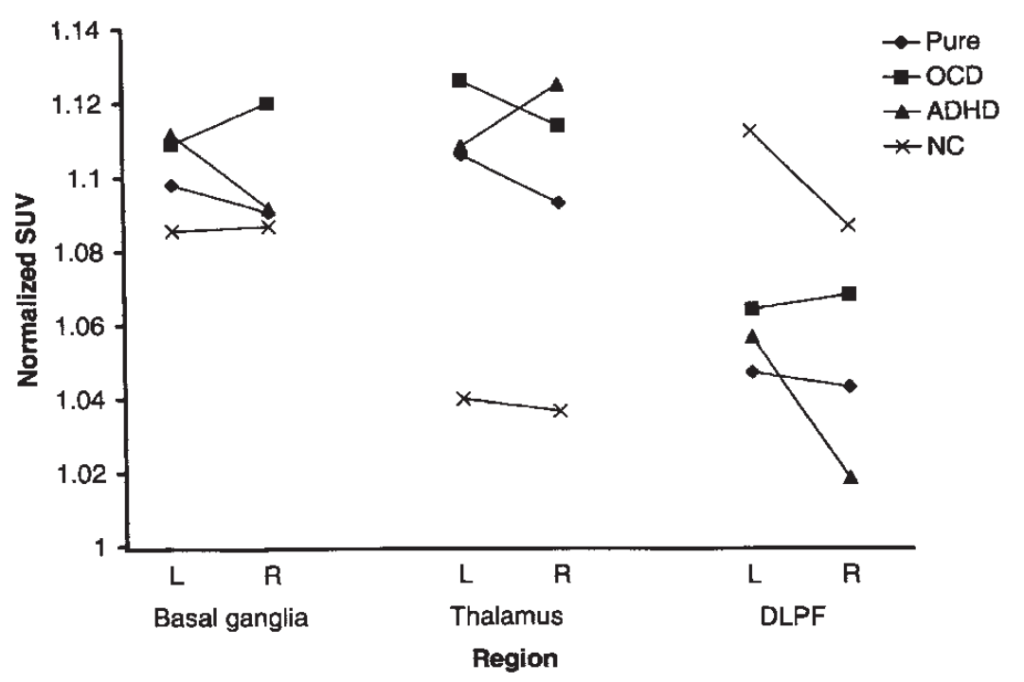
The overall TS (sub)group region side interaction for normalized regional values was significant (P 0.046). Follow-up tests revealed decreased right DLPF for the ADHD group compared to the OCD and Pure TS groups (P 0.002), and opposite subcortical patterns for the ADHD (left> right basal ganglia (caudate, lentiform); right> left thalamus) and OCD (right> left basal ganglia; left> right thalamus) groups (see Figs. 3 and 4).
Relationship of AMT uptake with tic severity
Correlations within the TS group between tic severity and regional normalized values and AIs for the four regions tested were not significant, although there was a trend for increased tic severity and increased right> left thalamic asymmetry (P 0.021).
Discussion
This study demonstrates cortical and subcortical abnormalities of in vivo tryptophan metabolism in TS patients. Some of the regional abnormalities of AMT uptake appear to be related to TS per se, others with behavioral phenotype. Although abnormal AMT uptake may occur both due to altered serotonin synthesis and increased tryptophan metabolism via the kynurenine pathway, the latter requires an inflammatory condition or presence of a tumor, which is not the case in TS. Thus, findings provide novel neuroimaging evidence demonstrating the role of abnormal serotonergic metabolism in the pathophysiology of TS, and add to the body of work suggesting abnormal serotonergic transmission in TS.(11–13)
Neuroimaging findings in TS
Previous neuroimaging studies have suggested abnormalities in the subcortical components of the frontostriato-thalamic circuit in TS. For example, a recent PET study revealed reduced 5-HT2A receptor binding in the basal ganglia (and other brain regions).(13) MRI volumetric studies of subcortical nuclei in TS reported decreased basal ganglia and thalamic volumes, including volume decreases in the caudate nucleus.(25) Interestingly, our present study showed increased AMT uptake in caudate nuclei and thalamus for the TS group (Fig. 1). Since decreased caudate volume by itself would likely cause a decrease in apparent AMT uptake, such increases on PET are unlikely to be explained by volume loss, which would lead to decreased apparent uptake without correction for volume differences. Indeed, in structures with a presumed moderate volume loss (such as the caudate nucleus), our measured values may have slightly underestimated AMT uptake. Previous PET studies evaluating involvement of the dopaminergic system in TS have reported elevated striatal dopamine transporter levels,(6) abnormal presynaptic DOPA decarboxylase activity,(26) and increased dopamine release in the striatum of patients with TS.(27) Our findings provide the first imaging evidence of abnormal tryptophan metabolism in the fronto-striato-thalamic circuit in TS.
In addition to subcortical abnormalities, there is also imaging support for involvement of the frontal lobe in the pathology of TS. Recent MRI studies have shown decreased deep white matter volumes of the frontal cortex, smaller right frontal lobe,(28) and variable volume changes in frontal regions in TS patients.(29) A disproportionate increase of frontal lobe white matter has also been described.(30) FDG PET studies have reported both decreased and increased normalized glucose metabolic rates in various parts of the frontal lobe.(31–33) In the present study, we found DLPF cortical decreases of AMT uptake in TS patients as compared to controls, and further, increased ratios of AMT uptake in subcortical structures to DLPF AMT uptake (Fig. 2). These findings suggest a general impairment of cortical-subcortical serotonergic function in TS.
Correlations with neuropsychological findings
Results of the present study suggest that corticalsubcortical dysregulation is associated with TS per se (Figs. 1 and 2), whereas phenotypic presentation may be associated with the pattern of relationships in AMT uptake among components of the fronto-striato-thalamic circuit (Figs. 3 and 4). Specifically, OCD and ADHD comorbid subgroups were associated with different patterns of AMT uptake; patterns that are consistent with previous neuroscience research on these diagnostic problems.(34 –38) These results provide support for the potential usefulness of creating more homogeneous groups within the TS population in research evaluating brain– behavior relationships.
Implications in pathophysiology of TS
One of the current theories on pathomechanisms of TS suggests an imbalance between direct and indirect striato-pallidal pathway tone, causing overactivity in neuronal circuits controlled by various neurotransmitter systems.(39) This imbalance may be responsible for hyperkinetic movements and behavioral dysfunction. Our present data suggest a cortico-subcortical imbalance in the serotonergic system. Serotonergic neurons are known to have inhibitory influence on dopamine metabolism and on the function of dopamine neurons; destruction of the raphe nuclei in animal experiments results in elevated dopamine activity in the striatum.(40) However, because of the close pathogenetic, metabolic, and genetic correlations among various neurotransmitter systems, determining which dysfunction is primary, secondary, or incidental, remains a challenge. Of note is that, unlike TS, most movement disorders that are primarily associated with dopamine dysfunction have a progressive course.
Increased subcortical, including striatal, AMT uptake in TS patients may indicate an overproduction of excitatory tryptophan metabolites. Indeed, chronic striatal infusion of quinolinic acid in rats results in motor stereotypies.(41) The resulting excitotoxic brain injury may also account for the volume loss in the caudate nucleus found in patients with TS. It is also possible that the actual tracer uptake shown by AMT PET depends on which stage of the disease is studied. Future studies comparing striatal AMT uptake during exacerbation of motor tics versus periods with relatively mild symptoms in the same individual could test this hypothesis.
Implication of increased quinolinic acid production in the striatum may also link abnormal tryptophan metabolism to the well-documented abnormalities of dopamine metabolism in TS. Activation of NMDA receptors by increased quinolinic acid production may lead to increased striatal dopamine release; this has been reported following activation of NMDA receptors.(42) In addition, it has been shown that quinolinic acid injections in rat striatum can cause degeneration of GABAergic neurons,(43) which are essential components of frontal-subcortical circuits.(39) These inhibitory neurons, which are located in both cortical and basal ganglia regions, provide the primary projections for both the globus pallidus interna (direct) and globus pallidus externa (indirect) pathways. GABA-modulating agents have been used with moderate success in the treatment of tics.(44)
Methodological issues
Some methodological issues should be considered when interpreting our findings. Theoretically, sympathomimetic therapy may interfere with cerebral serotonin metabolism. While all patients stopped their medications 4 weeks before AMT PET scanning and while comparisons between medication groups showed no differences in global or regional AMT uptake, it remains possible that medication effects persisted. Another methodological issue is that no MRI-based correction for partial volume effects was performed in our patients. Thus, it cannot be entirely excluded that some of the findings were confounded by subtle structural changes (e.g., volume loss). However, major findings included increases in AMT uptake in subcortical structures, several of which are reported to be structurally smaller in TS.(25) These findings are unlikely to be due to partial volume effects. Nevertheless, future PET studies in TS should directly compare quantitative MRI data with PET findings. Finally, while categorization of patients according to their neuropsychological profile resulted in phenotypically more homogeneous groups and revealed further regional abnormalities, given the small sample size of the diagnostic groups, the findings are considered preliminary and warrant further AMT PET studies of TS patients with and without comorbid conditions.
References
1. Como PG. Neuropsychological function in Tourette syndrome. In: Cohen DJ, Jankovic J, Goetz CG, editors. Tourette syndrome, Advances in neurology, Vol. 85. Philadelphia: Lippincott Williams & Wilkins; 2001. p 103–111.
2. Berardelli A, Curra A, Fabbrini G, Gilio F, Manfredi M. Pathophysiology of tics and Tourette syndrome. J Neurol 2003;250:781– 787.
3. Stern E, Silbersweig DA, Chee KY et al. A functional neuroanatomy of tics in Tourette syndrome. Arch Gen Psychiatry 2000;57: 741–748.
4. Jeffries KJ, Schooler C, Schoenbach C, Herscovitch P, Chase TN, Braun AR. The functional neuroanatomy of Tourette’s syndrome: an FDG PET study III: functional coupling of regional cerebral metabolic rates. Neuropsychopharmacology 2002;27:92–104.
5. Leckman JF. Tourette’s syndrome. Lancet 2002;360:1577–1586.
6. Krause KH, Dresel S, Krause J, Kung HF, Tatsch K, Lochmuller H. Elevated striatal dopamine transporter in a drug naive patient with Tourette syndrome and attention deficit/ hyperactivity disorder: positive effect of methylphenidate. J Neurol 2002;249:1116 – 1118.
7. Leckman JF, Anderson GM, Cohen DJ, et al. Whole blood serotonin and tryptophan levels in Tourette’s disorder: effects of acute and chronic clinidine treatment. Life Sci 1984;35:2497–2503.
8. Leckman JF, Goodman WK, Anderson GA, et al. Cerebrospinal fluid biogenic amines in obsessive compulsive disorder, Tourette’s syndrome, and healthy controls. Neuropsychopharmacology 1995; 12:73– 86.
9. Butler IJ, Koslow SH, Seifert WE, Caprioli RM, Singer HS. Biogenic amine metabolism in Tourette syndrome. Ann Neurol 1979;6:37–39.
10. Anderson GM, Pollak ES, Chatterjee D, et al. Postmortem analysis of subcortical monoamines and amino acids in Tourette syndrome. Adv Neurol 1992;58:123–133.
11. Muller-Vahl KR, Meyer GJ, Knapp WH, et al. Serotonin transporter binding in Tourette syndrome. Neurosci Lett 2005;385:120 – 125.
12. Heinz A, Knable MB, Wolf SS, et al. Tourette’s syndrome: [I-123]beta-CIT SPECT correlates of vocal tic severity. Neurology 1998;51:1069 –1074.
13. Haugbol S, Pinborg LH, Regeur L, et al. Cerebral 5-HT2A receptor binding is increased in patients with Tourette’s syndrome. Int J Neuropsychopharmacol 2007;10(2):245–252.
14. Diksic M, Nagahiro S, Sourkes TL. Biological model for the in vivo measurement of rate of serotonin synthesis in the brain. J Neural Transm Suppl 1990;29:131–140.
15. Chugani DC, Muzik O, Chakraborty P, Mangner T, Chugani HT. Human brain serotonin synthesis capacity measured in vivo with alpha-[C-11]methyl-L-tryptophan. Synapse 1998;28:33– 43.
16. Juhasz C, Chugani DC, Muzik O, et al. In vivo uptake and metabolism of alpha-[11C]methyl-L-tryptophan in human brain tumors. J Cereb Blood Flow Metab 2006;26:345–357.
17. Chugani DC, Muzik O, Behen M, et al. Developmental changes in brain serotonin synthesis capacity in autistic and nonaustic children. Ann Neurol 1999;45:287–295.
18. Leckman JF, Towbin KE, Ore SI, Cohen DJ. Clinical assessment of tic disorder severity. In: Cohen DJ, Bruun R, Leckman JF, editors. Tourette syndrome and tic disorders: clinical understanding and treatment. Wiley: New York, NY; 1988.
19. Scahill L, Riddle MA, McSwiggan-Hardin, Ort SI, King RA, Goodman WK, Leckman JF. Children’s Yale-Brown Obsessive Compulsive Scale: Reliability and validity. Am J Child Adolesc Psychiatry 1997;36:844 – 852.
20. Goodman WK, Price LH, Rasmussen SA, et al. The Yale-Brown Obsessive Compulsive Scale: I. Development, use, and reliability. Arch Gen Psychiatry 1989;46:1006 –1011.
21. Reynolds CR, Kamphaus RW. The Behavioral Assessment Scales for Children. American Guidance Service 1992: Circle Pines, MN.
22. Muzik O, Chugani DC, Chakraborty P, Manger T, Chugani HT. Analysis of [C-11]alpha-methyl-tryptophan kinetics for the estimation of serotonin synthesis rate in vivo. J Cereb Bllod Flow Metab 1997;17:659 – 669.
23. Pietrzyk U, Herholz K, Fink G, et al. An interactive technique for 3 dimensional image registration: validation for PET, SPECT, MRI and CT brain studies. J Nucl Med 1994;35:2011–2018.
24. Winer BJ, Brown DR, Michels KM. Statistical principles in experimental design, 3rd ed. McGraw-Hill: New York, NY; 1991.
25. Bloch MH, Leckman JF, Zhu H, Peterson BS. Caudate volumes in childhood predict symptom severity in adults with Tourette syndrome. Neurology 2005;65(8):1253–1258.
26. Ernst M, Zametkin AJ, Jons PH, Matochik JA, Pascualvaca D, Cohen RM. High presynaptic dopaminergic activity in children with Tourette’s disorder. J Am Acad Child Adolesc Psychiatry 1999;38:86 –94.
27. Singer HS, Szymanski S, Giuliano J, et al. Elevated intrasynaptic dopamine release in Tourette’s syndrome measured by PET Am J Psychiatry 2002;159:1329 –1336.
28. Kates WR, Frederikse M, Mostofsky SH, et al. MRI parcellation of the frontal lobe in boys with attention deficit hyperactivity disorder or Tourette syndrome. Psychiatry Res 2002;116:63– 81.
29. Peterson BS, Staib L, Scahill L, et al. Regional brain and ventricular volumes in Tourette syndrome. Arch Gen Psychiatry 2001; 58:427– 440.
30. Fredericksen KA, Cutting LE, Kates WR, et al. Disproportionate increases of white matter in right frontal lobe in Tourette syndrome. Neurology 2002;58:85– 89.
31. Braun AR, Stoetter B, Randolph C, et al. The functional neuroanatomy of Tourette’s syndrome: an FDG-PET study I. Regional changes in cerebral glucose metabolism differentiating patients and controls. Neuropsychopharmacology 1993;9:277–291.
32. Eidelberg D, Moeller JR, Antonini A, et al. The metabolic anatomy of Tourette’s syndrome. Neurology 1997;48:927–934.
33. Braun AR, Randolph C, Stoetter B, et al. The functional neuroanatomy of Tourette’s syndrome: an FDG-PET study II. Relationships between regional cerebral metabolism and associated behavioral and cognitive features of the illness. Neuropsychopharmacology 1995;13:151–168.
34. Singer HS, Reiss AL, Brown JE, et al. Volumetric MRI changes in basal ganglia of children with Tourette’s syndrome. Neurology 1993;43(5):950 –956.
35. Teicher MH, Anderson CM, Polcari A, Glod CA, Maas LC, Renshaw PF. Functional deficits in basal ganglia of children with attention-deficit/hyperactivity disorder shown with functional magnetic resonance imaging relaxometry. Nat Med 2000;6:470 – 473.
36. Saxena S, Rauch SL. Functional neuroimaging and the neuroanatomy of obsessive-compulsive disorder. Psychiatr Clin North Am 2000;23:563–584.
37. Schrimsher GW, Billingsley RL, Jackson EF, Moore BD III. Caudate nucleus volume asymmetry predicts attention-deficit hyperactivity disorder (ADHD) symptomatology in children. J Child Neurol 2002;17:877– 884.
38. Krause KH, Dresel SH, Krause J, la Fougere C, Ackenheil M. The dopamine transporter and neuroimaging in attention deficit hyperactivity disorder. Neurosci Biobehav Rev 2003;27:605– 613.
39. Singer HS. Neurobiology of Tourette syndrome. Neurol Clin 1997; 15(2):357–379.
40. Rommelspacher H, Strauss S. Effect of lesions of raphe nuclei on the activity of catecholaminergic and serotonergic neurones in various brain regions of the rat in vivo. J Neural Transm 1980; 49(1–2):51– 62.
41. Bazzett TJ, Falik RC, Becker JB, Albin RL. Chronic intrastriatal administration of quinolinic acid produces transient nocturnal hypermotility in the rat. Brain Res Bull 1996;39:69 –73.
42. Hernandez LF, Segovia G, Mora F. Effects of activation of NMDA and AMPA glutamate receptors on the extracellular concentrations of dopamine, acetylcholine, and GABA in striatum of the awake rat: a microdialysis study. Neurochem Res 2003;28:1819 –1827.
43. Beal MF, Ferrante RJ, Swatz KJ, Kowall NW. Chronic quinolinic acid lesions in rats closely resemble Huntigton’s disease. J Neurosci 1991;11:1649 –1659.
44. Goetz CG. Clonidine and clonazepam in Tourette syndrome. Rev Adv Neurol 1992;58:245–251.